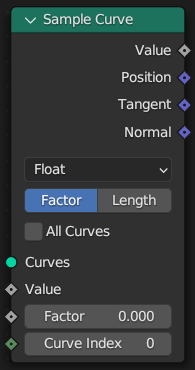
Sample Curve Node

The Sample Curve calculates a point on a curve at a certain distance from the start of the curve, specified by the length or factor inputs. It also outputs data retrieved from that position on the curve. The sampled values are linearly interpolated from the values at the evaluated curve points at each side of the sampled point.
Muista
When the curve contains multiple splines, the sample position is found based on the total accumulated length, including the lengths of all previous splines. The order of the splines is the same order as displayed in the Spreadsheet Editor.
Inputs
- Curves
Standard geometry input with a curve component.
- Input
A field input to evaluate custom attributes. The evaluation is outputted through the Value output.
- Factor Factor mode
The portion of the total length used to determine the sample position.
- Length Length mode
A length in distance units used to determine how far along the curve to travel before sampling.
- Curve Index
An index to only evaluate specific splines, these indices can be specified manually or from the Index Node. This input is ignored when the All Curves property is enabled.
Properties
- Data Type
The data type used for the evaluated data.
- Mode
How to find endpoint positions for the trimmed spline. The option acts the same as it does in the Trim Curve Node.
- Factor
Find the endpoint positions using a factor of each spline’s length. The input values should be between 0 or 1.
- Length
Find the endpoint positions using a length from the start of each spline. The input values should be between 0 and the length of the splines.
- All Curves
Sample lengths based on the total length of all curves, rather than using a length inside each selected curve.
Outputs
- Value
The value of the input Value at the sample point.
- Position
The position at the sample along the spline.
- Tangent
The normalized curve tangent at the sample.
Vihje
This output can be combined with the Align Euler to Vector Node to create a rotation that lines up with direction of the curve. Including the Normal output in a second align node after can align the other rotation axis.
- Normal
The normalized curve normal at the sample.
Examples

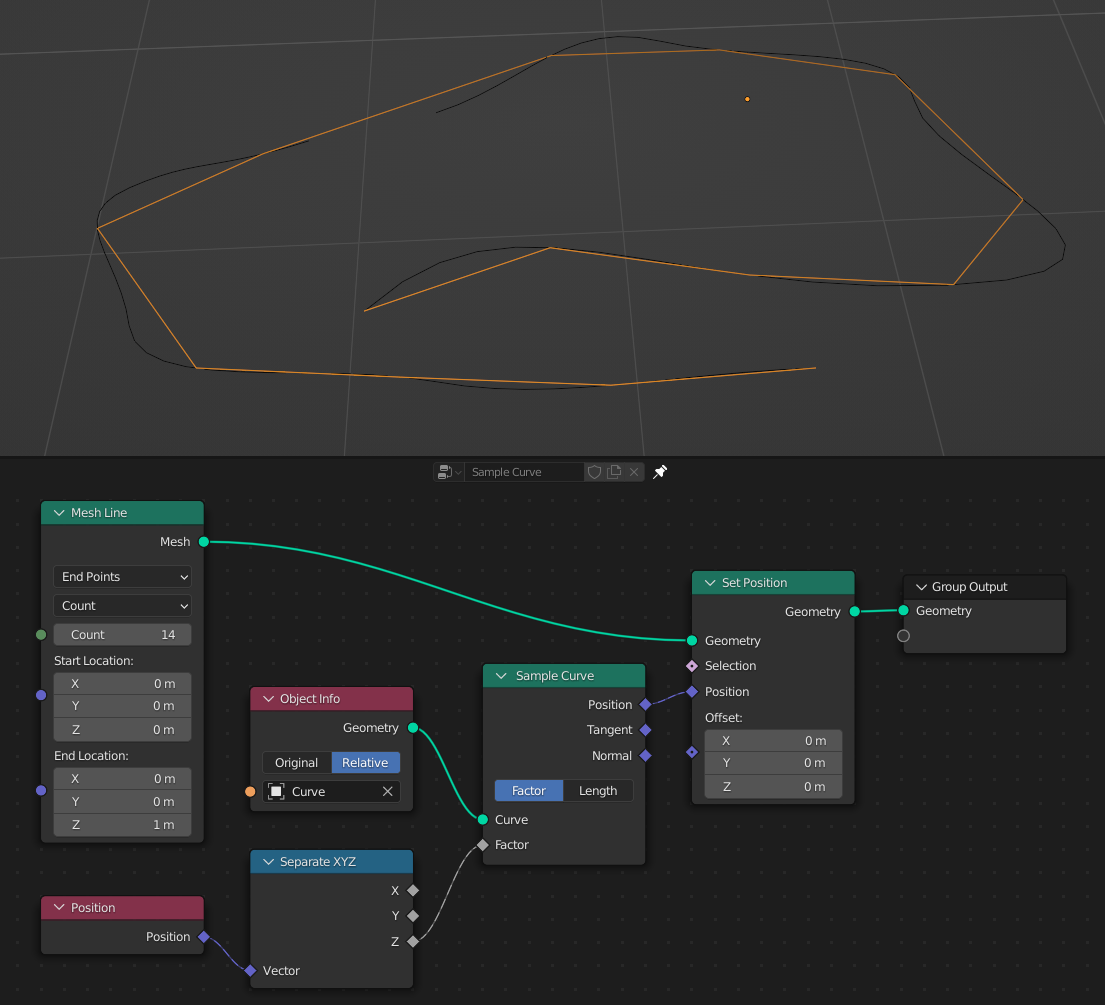
Here, the Count mode of the Resample Curve Node is recreated, except a mesh is used for the result instead of a curve. The Z axis of the position can be used as the sample factor because the position is between zero and one for the entire line.