Spreadsheet
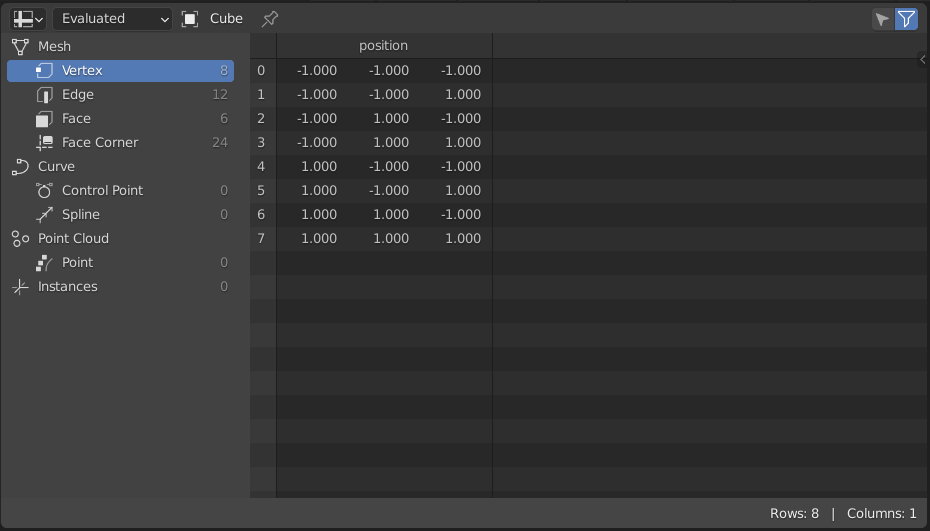
The Spreadsheet editor is used to inspect geometry attributes.

The Spreadsheet editor.
Header
- Object Evaluation State
Display the data of an object at different states of its evaluation.
- Evaluated
Display data from the object with all modifiers applied.
- Original
Display data from the original object without any modifiers applied.
- Viewer Node
Display data from the active Viewer node of the active object.
- Breadcrumbs
The breadcrumbs show three key parts of the path the evaluated object takes before showing the information in the Main Region. In the order from left to right, the first item displayed is the Active object. The next two items are displayed when the Viewer node evaluation state is chosen. The first of these next items is the name of the Geometry Nodes modifier, the last item shown is the name of the active Viewer node.
Clicking the arrow between items hides the name of the active modifier.
- Toggle Pin
Usually, the editor displays data from the active object. When an object is pinned, its data remains visible, even if another object becomes active.
- Selected Only
This option is only available if the object is in Edit Mode. When checked, only data for the selected mesh elements is shown.
Main Region
The main view allows you to view the actual spreadsheet. Row indices and column names remain visible when scrolling down or to the side.
Data Set Region
With the Data Set region on the left you can choose which geometry component and geometry domain to view. For each attribute domain its size is displayed, for example the number of faces.
- Mesh
Mesh component containing point, corner, face and edge data.
- Vertex
Display attributes that are stored per vertex.
- Edge
Display attributes that are stored per edge.
- Face
Display attributes that are stored per face.
- Face Corner
Display attributes that are stored per face corner.
- Curve
Display curve data which are the attributes on splines and control points.
- Control Point
Display attributes that are stored per control point.
- Spline
Display attributes that are stored per spline.
- Point Cloud
Point cloud component containing only point data.
- Point
Display attributes that are stored per point.
- Volume Grids
Display OpenVDB volume grid data, each grid will be represented with the Grid Name, the Data Type, and the Class. The class can be either of: Fog Volume, Level Set, or Unknown.
- Instances
Display which objects and collections are instanced and their transforms.
Status Bar
The status bar shows how many rows and columns there are and how many have been filtered out.