Viewport Display(ビューポート表示)
- Thickness(幅)
Factor that scales the thickness of the grid that is currently being displayed.
- Interpolation(補間)
流体グリッドの視覚化に使用する補間方法。
- Linear(リニア)
ボクセル間の線形補間。優れた滑らかさとスピードを提供します。
- Cubic(三次式)
ボクセル間のキュービック補間。高品質の滑らかさの補間を提供しますが、速度は遅くなります。
- Closest(近接)
ボクセル間の補間はありません。生のボクセルを提供します。
- Slice per Voxel
Determines how many slices per voxel should be generated.
Slice(スライス)
ドメインオブジェクトの単一の2Dセクションのみをレンダリングします。
- Axis(座標軸)
- Auto(自動)
ビューの方向に応じてスライスの方向を調整します。
- X/Y/Z
Slice along the X/Y/Z axis.
- Position(位置)
それぞれのドメイン側の長さに対するスライスの位置。
- Gridlines Closest Interpolation Only
Display gridlines to differentiate the underlying cells in the current slice of the fluid domain.
Grid Display
Use a specific color map for the visualization of the simulation field. This comes in handy during debugging or when making more advanced adjustments to the simulation. For instance, if the actual color of a fire simulation is barely visible in the viewport then changing the color profile can help to see the real size of the flame.
- Field
The simulation field used in the display options (e.g. density, fuel, heat).
Comparison of a fire simulation with and without color mapping.¶ 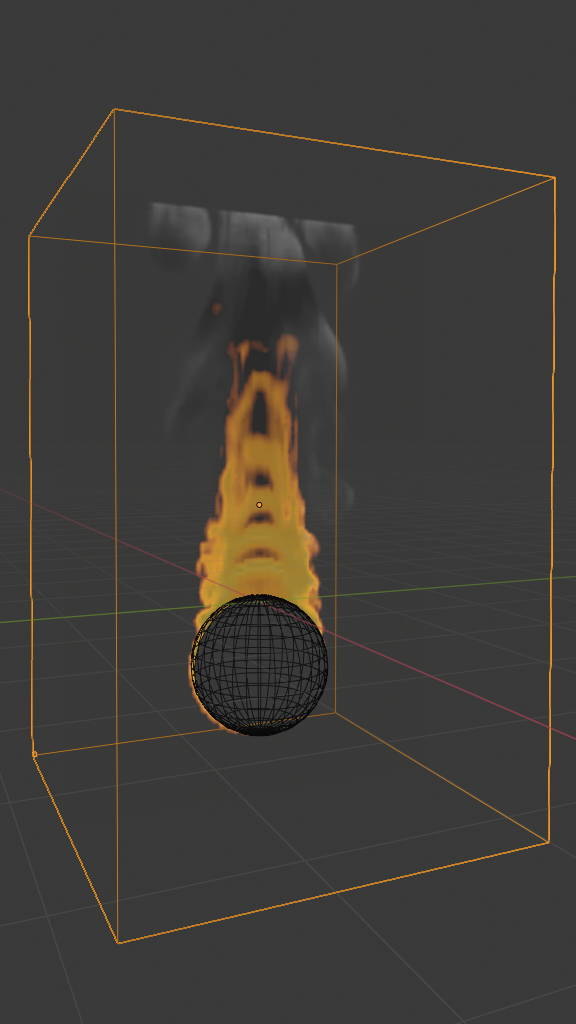
Slice view of "fire" grid without color mapping.
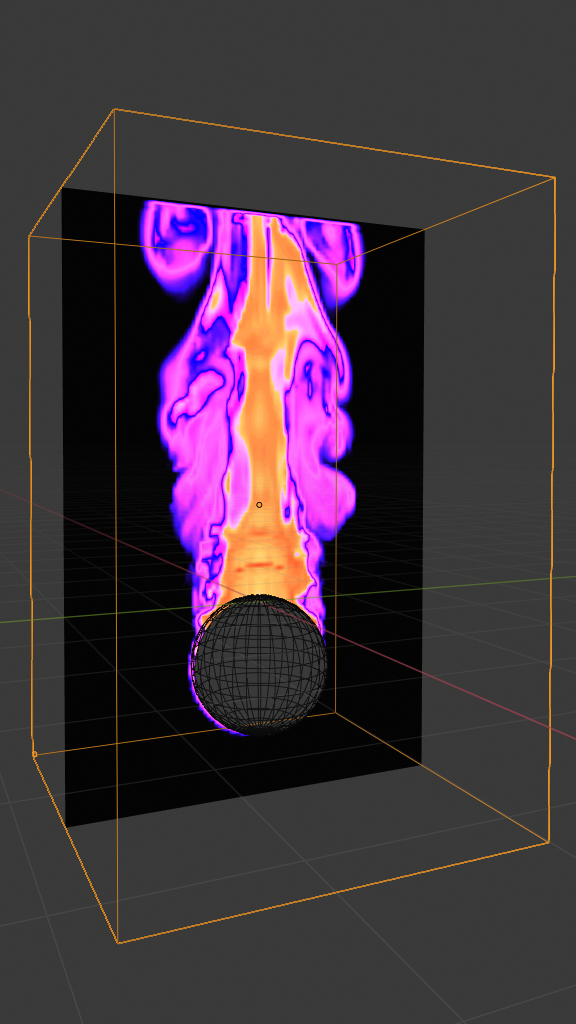
Slice view of "fire" grid with color mapping.
- Scale(スケール)
Scale the selected simulation field by this value.
Vector Display
Visualization options for the vector fields.
- Display As(表示方法)
- Streamlines
Choose to display the vectors as "Streamlines".
- Needle
Choose to display the vectors as "Needles".
- MAC Grid
Choose to display the vector field as "Marker-And-Cell Grid".
- X/Y/Z
Show an individual X/Y/Z component of the MAC grid.
- Magnitude Streamlines or Needle Only
Scale the display vectors by the magnitude of the vectors they represent.
- Field
The vector field represented by the display vectors (e.g. fluid velocity, external forces).
- Scale(スケール)
Scale the vectors by this size in the viewport.
Advanced Gridlines Only
Advanced coloring options for gridlines.
- Color Gridlines
- Flags
Color gridlines with flags.
- Highlight Range Grid Display Only
Highlight the cells with values of the displayed grid within the range. Values between the Lower Bound and Upper Bound (inclusive) are considered to be within the range.
- Lower Bound
Lower bound of the highlighting range.
- Upper Bound
Upper bound of the highlighting range.
- Color(カラー)
Color used to highlight the cells.
- Cell Type
Choose to highlight only a particular type of cells.