Scopes
Scopes in the Image editor.
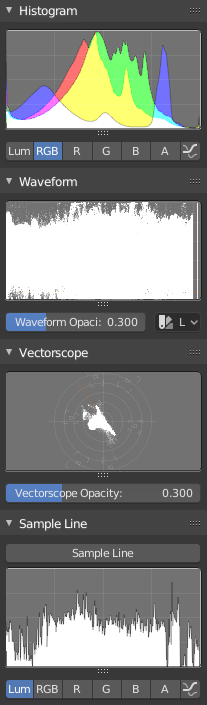
Histogram
This mode displays a graph showing the distribution of color information in the pixels of the currently displayed image. The X axis represents values of pixel, from 0 to 1 (or 0 to 255), while the Y axis represents the number of pixels in that tonal range. A predominantly dark image would have most of its information toward the left side of the graph.
Use this mode to balance out the tonal range in an image. A well balanced image should have a nice smooth distribution of color values.
- Luma
Shows the luminosity of an image.
- RGB
Shows the RGB channels stacked on top of each other.
- R/G/B/A
Depending on the channel you choose the scope will show the appropriate channel.
- Show Line
Displays lines rather than filled shapes.
Waveform
- Waveform Opacity
Opacity of the points.
- Waveform Mode
- Luma
ToDo.
- YCbCr
ToDo.
- Parade
The RGB channels are shown side-by-side.
- Red Green Blue
Shows the RGB channels overlaid as a “Full color” waveform. It is useful for color grading.
Vectorscope
- Vectorscope Opacity
Opacity of the points.
Sample Line
The Sample Line scope is the same as the Histogram but allows you to get the sample data from a line.
- Sample Line
Used to draw a line to use to read the sample data from.
Scope Samples
- Full Sample
Sample every pixel.
- Accuracy
Proportion of original image source pixel lines to sample.