Introdução
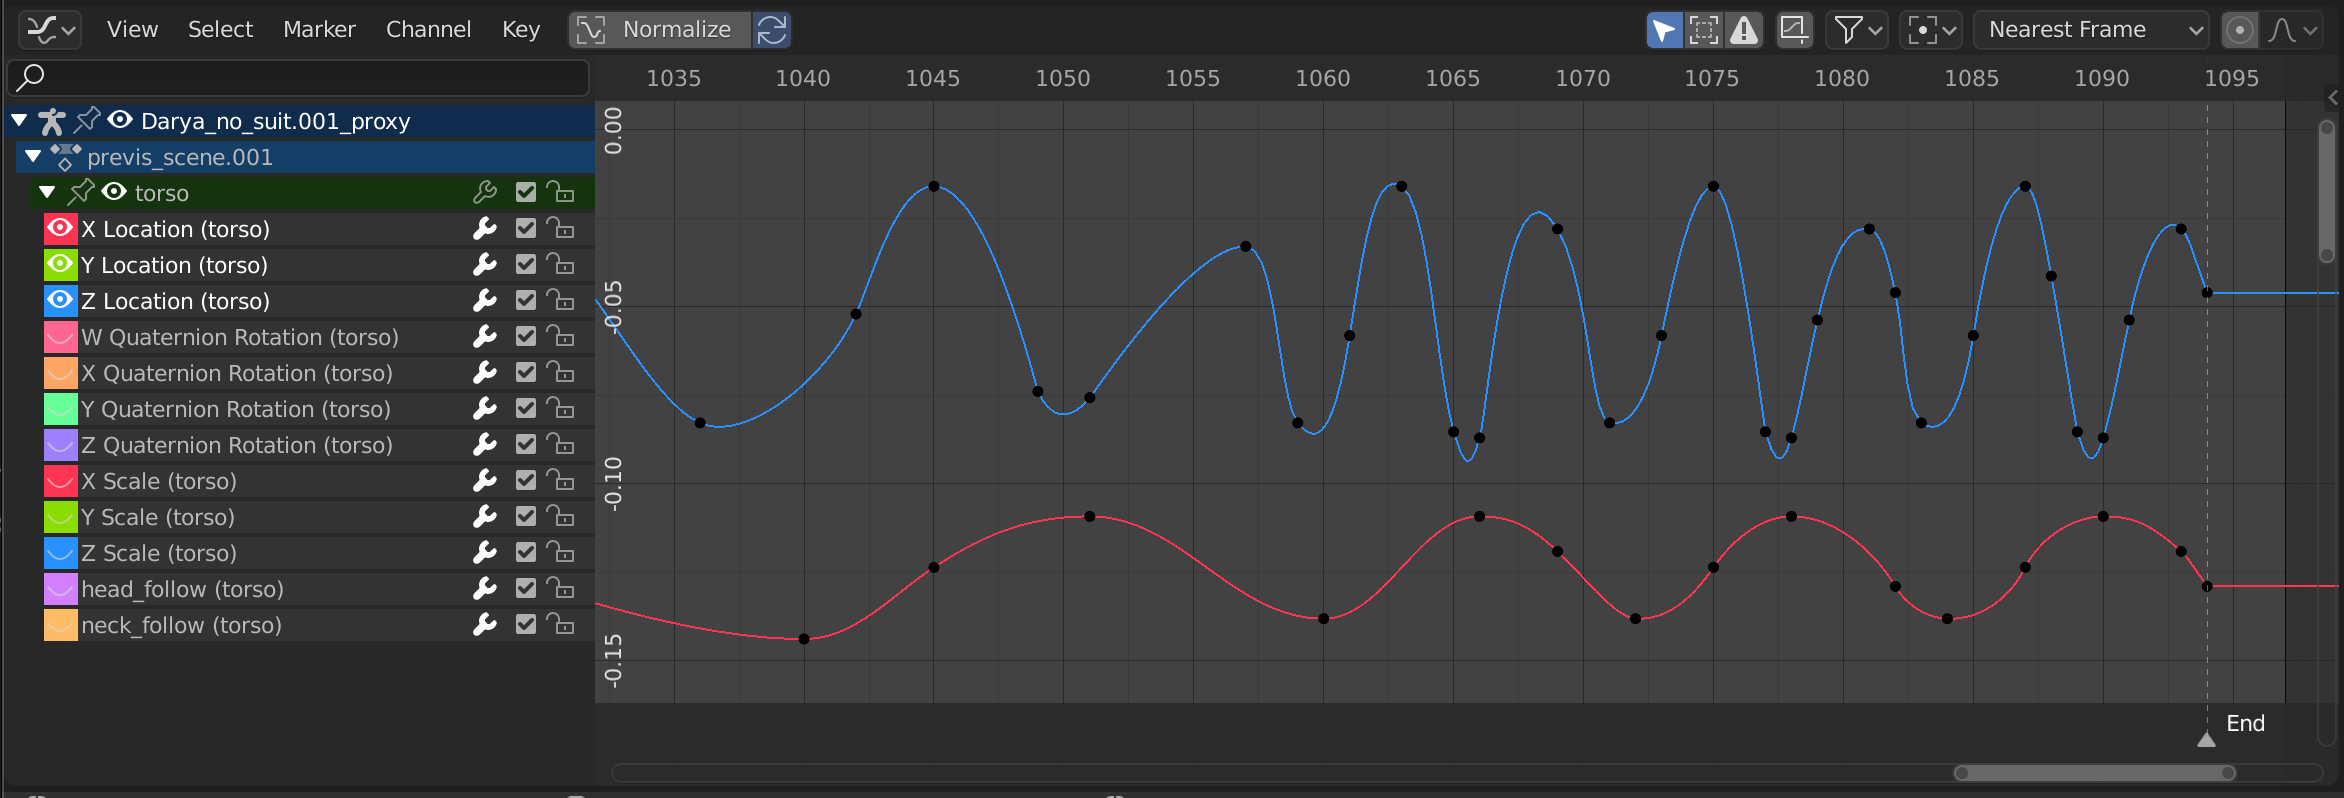
The Graph Editor allows users to adjust animation curves over time for any animatable property. F-Curves.

O Editor gráfico.
Região principal
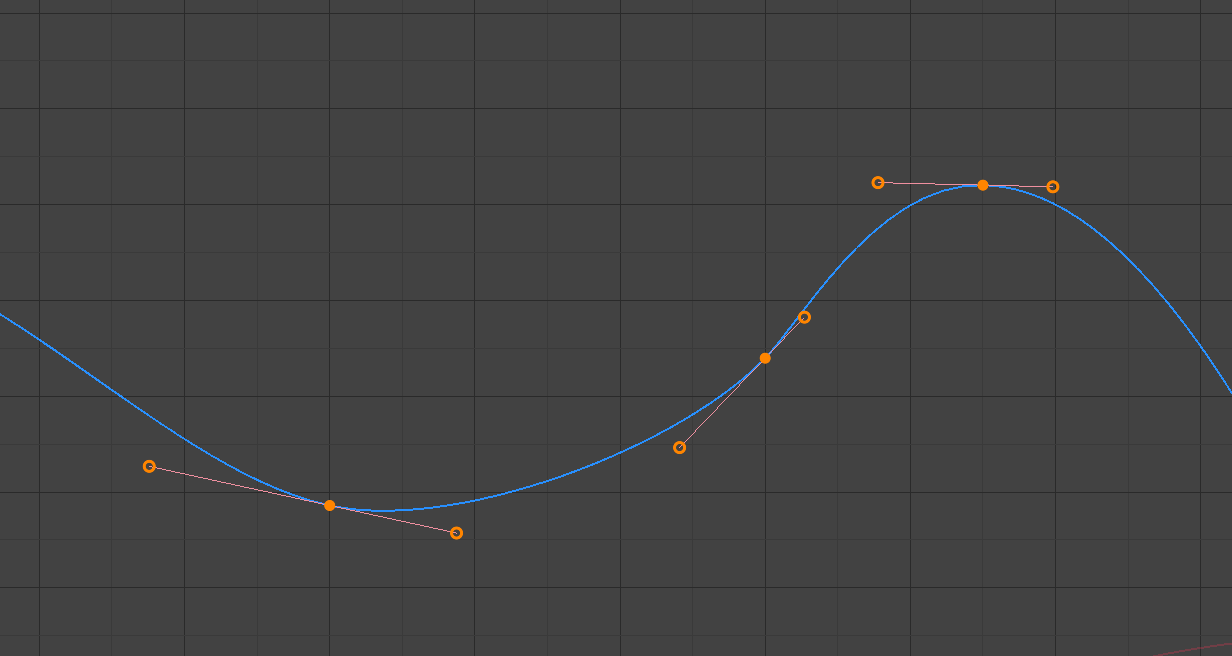
The curve view allows you to view and edit F-curves. An F-curve has several key parts:
- Curve
The curve defines the value (Y axis) of the property over time (X axis).
See F-Curves.
- Quadros-chave
Keyframes are user-defined values on certain frames and are represented by little black squares which become orange if selected.
See Keyframes for more information.
- Hastes
Each keyframe has a handle that helps determine the values of the curve between keyframes. These handles are represented by extruding lines with circular ends and can be selected and modified to change the shape of the curve.
See F-Curve Handles for more information.

A simple curve.
Veja também
See F-Curves for more info.
Playhead & 2D Cursor

O cursor 2D do editor gráfico.
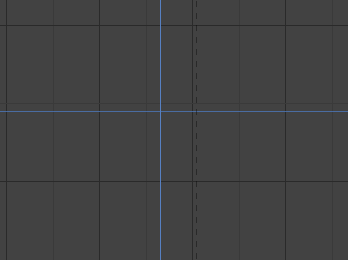
The current frame is represented by a blue vertical line called the Playhead.
As in the Timeline, you can change the current frame by LMB-dragging in the scrubbing area at the top of the editor.
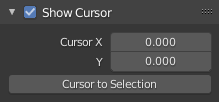
The blue horizontal line is called the 2D Cursor. This can be enabled or disabled via the View Menu or the View Properties panel.
These two lines can be used as a reference for moving and scaling keyframe handles.
Veja também
See Graph Editor’s Visualizar (aba).
Eixos de visualização
For Actions the X axis represents time, the Y axis represents the value to set the property.
Depending on the selected curves, the values have different meaning: for example rotation properties are shown in degrees.
Header
Controles de visualização

View controls.
- Show Only Selected
Inclui somente as curvas que são relacionadas aos dados e objetos selecionados.
- Show Hidden
Inclui as curvas a partir dos objetos ou ossos que não estão visíveis.
- Show Only Errors
Only include curves and drivers that are disabled or have errors. Useful for debugging.
- Filter (funnel icon)
Only include curves with keywords contained in the search field.
- Multi-Word
Fuzzy/Multi-Word name filtering matches word snippets/partial words, instead of having to match everything. It breaks down the search text based on whitespace placement. e.g. «lo ro» will filter all location and rotation, while «lc rt» will not work.
- Tipo de filtro
Filtra as curvas pelos tipos de propriedades.
- Filtering Collection
Select a collection to only show keyframes from objects contained in that collection.
- Sort Data-Blocks
Objects data-blocks appear in alphabetical order, so that it is easier to find where they occur (as well as helping to keep the animation of related objects together in the NLA for instance).
If you find that your playback speed suffers from this being enabled (it should only really be an issue when working with lots of objects in the scene), you can turn this off.
- Normalizar
Normalize curves so the maximum or minimum point equals 1.0 or -1.0.
- Automático
Automatically recalculate curve normalization on every curve edit. This is useful to prevent curves from jumping after tweaking it.
F-Curve Controls

F-Curve controls.
- Edição proporcional O
See Proportional Editing.
- Atração automática
Auto snap the keyframes for transformations.
Sem atração automática
Intervalos de quadros
Intervalos de segundo
Quadros mais próximos
Segundos mais próximos
Marcadores mais próximos
- Pivot Point
Ponto de pivô para rotação.
- Centro da caixa circundante
Centro dos quadros-chave selecionados.
- Cursor 2D
Center of the 2D Cursor. Playhead + Cursor.
- Centros individuais
Rotate the selected keyframe Bézier handles.
- Create Ghost Curves (framed F-curve icon)
Creates a picture with the current shape of the curves.

