Display Mode – Режим Показу
There are different display modes available, each having a specific purpose.
Передогляд Зображення – Image Preview
The Image Preview mode shows you what the resulting video will look like when saved. This is the main working mode for adding strips and moving them around, cutting, grouping (making meta) and splicing them through special effects.
Хвилеформа Світності – Luma Waveform
Для вибраних каналів яскравості або світності, дає показ їх розкладки.
Хвилеформа світності дозволяє вам судити про якість розподілу світності по відеосигналу, ви можете тут оглядати хвилеформу світності замість використання звичайного показу виводу на кожному моніторі контролю.
The display plots for every scanline the luminance value. The lines are all drawn on top of each other. The points get brighter if the lines cross (which is very likely with several hundred scanlines). You will understand the picture most easily if you plug an oscilloscope to the Luma-video-output of your television set. It will basically look the same.
In this mode, the vertical axis represents the luminosity: 0 at the bottom, 1 at the top; the horizontal axis is a mapping from the horizontal axis of the frame. There are as many curves as scanlines in the frame: each one of these curves represents the luminosity of the pixels of one line. Moreover, the color of a pixel in this mode represents the number of pixels from the matching column of the frame sharing the same luminosity, i.e. the number of curves that cross at this point (black/transparent, for no pixel, white/opaque for at least three pixels).
- Відокремити Кольори – Separate Colors
Розокремлює RGB канали на окремі графи.
Цей режим добрий для:
Якщо хвилеформа не заповнює картинку повністю, то ви можливо схочете погратися з модифікатором «Яскравість/Контраст», допоки це не дасть заповнення всієї картинки (авторозтяг контрасту).
Разом більш просунутими модифікаторами «RGB Криві» – RGB Curves або «Колірний Баланс» – Color Balance ви зможете бути більш точними.
Ви можете оцінити, чи слід відкидати цей матеріал, за тим чи він повністю спотворений та відсічений вгорі або внизу.
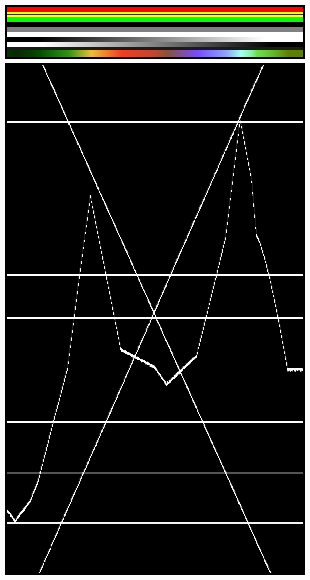
The various horizontal lines in the Luma waveform match the uniform-colored lines of the picture. Note that the „gray 20%“ one-pixel width line (inside the yellow strip) is represented in the Luma waveform by a gray line. The two lines drawing an «X» are from the two linear tone shades (white –> black and black –> white). Finally, the broken line matches the complex tone shade at the bottom of the picture.¶ |
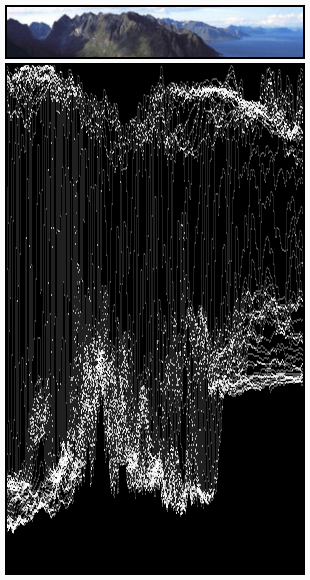
The curves are quite visible. We found a luma of 80-100% for the sky, a luma around 40% for the sea, and a luma of 10-20% for the mountains, growing around 40% for the sunny part.¶ |
Примітка
Ці картинки (перший зелений кадр, нагорі) мають висоту тільки 50 пікселів, щоб лімітувати кількість кривих, показуваних у Хвилеформі Світності – Luma waveform.
Use this display to check for appropriate contrast and luminosity across all frames in the channel. When spots in the film that should have even illumination do not, it looks like a flashbulb went off or an extra light was suddenly turned on. This can happen if two strips were rendered or shot under different lighting conditions but are supposed to be contiguous.
Вектороскоп Колірності – Chroma Vectorscope
Use this mode to judge the quality of the color-distribution and saturation, you can also view a U/V scatter-plot.
The picture is converted to YUV-format. The U and V values represent the angle of the color. For pixel of the picture, one point is plotted in the display at the U and V value position. If several pixels happen to have the same UV value the pixel in the plot gets brighter.
Щоб допомогти вам зрозуміти, що означає колір, показується гексаграма, що позначає крайні позиції (червоний, пурпурний, синій, блакитний, зелений, жовтий), з червоним хрестиком, який позначає початок.
In other words, for the selected channel, this display shows the color space of the image inside a hexagon. Each point of the hexagon is a primary color: red, magenta, blue, cyan, green, and yellow. Black is at the center, and overall saturation is scaled as dots closer to the outside. The example to the right shows that the image has a lot of red (50% saturation) and small amount of blue, with no green.
Always: remember to activate an additional control monitor of the end result. Color calibration is a matter of taste and depends on what you want.
Use this display to check for too much color saturation. While over-saturated images look great for op-art and computer displays, they might not when shown on the big screen TV.
Цей режим добрий для:
If your picture looks very moody or desaturated you might want to take a look at the U/V plot. You will most likely see all pixels building a crowd at the origin. If you add saturation using the Saturation slider in the Filter panel or any modifiers that change color, you can see in the U/V plot if you distort the color.
Якщо ви робите узгодження кольорів вручну, то ви можете узгодити кут, який бачите на різних моніторах каналів.
Ілюстрація прикладу.
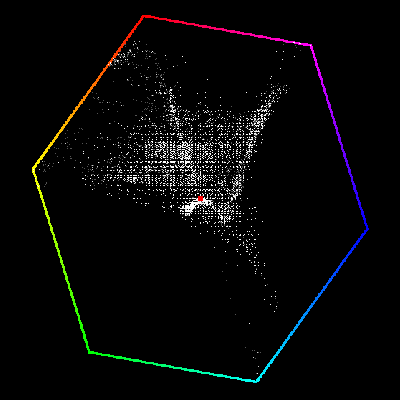
Приклад Передогляду Вектороскоп Колірності – Chroma Vectorscope.
Histogram – Гістограма
Цей режим показує граф, що демонструє розподіл інформації про кольори в пікселях поточно показуваного зображення. Вісь X представляє значення пікселя, від 0 до 1 (або 0 до 255), тоді як вісь Y представляє кількість пікселів у цьому тональному діапазоні. Переважно темне зображення матиме більшу частину його інформації в лівій частині цього графа.
Use this mode to balance out the tonal range in an image. A well balanced image should have nice and smooth distribution of color values.
Ілюстрація прикладу.
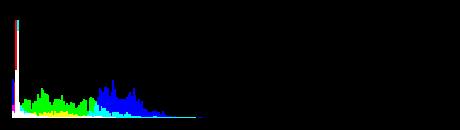
Приклад Передогляду Гістограма – Histogram.