Presentación en vistas
- Grosor
Factor that scales the thickness of the grid that is currently being displayed.
- Interpolación
Método de interpolación a utilizar para la visualización de la cuadrícula de fluido.
- Lineal
Interpolación lineal entre vóxeles. Da buena suavidad y velocidad.
- Cúbico
Interpolación cúbica entre vóxeles. Da una interpolación suavizada de alta calidad, pero es más lenta.
- Más Cercano
Sin interpolación entre vóxeles. Da vóxeles en bruto.
- Slice per Voxel
Determines how many slices per voxel should be generated.
Rebanar
Representa sólo una única sección 2D del objeto de dominio.
- Eje
- Automático
Ajusta la dirección del corte según la dirección de la vista.
- X/Y/Z
Slice along the X/Y/Z axis.
- Posición
Posición del corte en relación con la longitud del lado del dominio respectivo.
- Gridlines Closest Interpolation Only
Display gridlines to differentiate the underlying cells in the current slice of the fluid domain.
Grid Display
Use a specific color map for the visualization of the simulation field. This comes in handy during debugging or when making more advanced adjustments to the simulation. For instance, if the actual color of a fire simulation is barely visible in the viewport then changing the color profile can help to see the real size of the flame.
- Field
The simulation field used in the display options (e.g. density, fuel, heat).
Comparison of a fire simulation with and without color mapping. 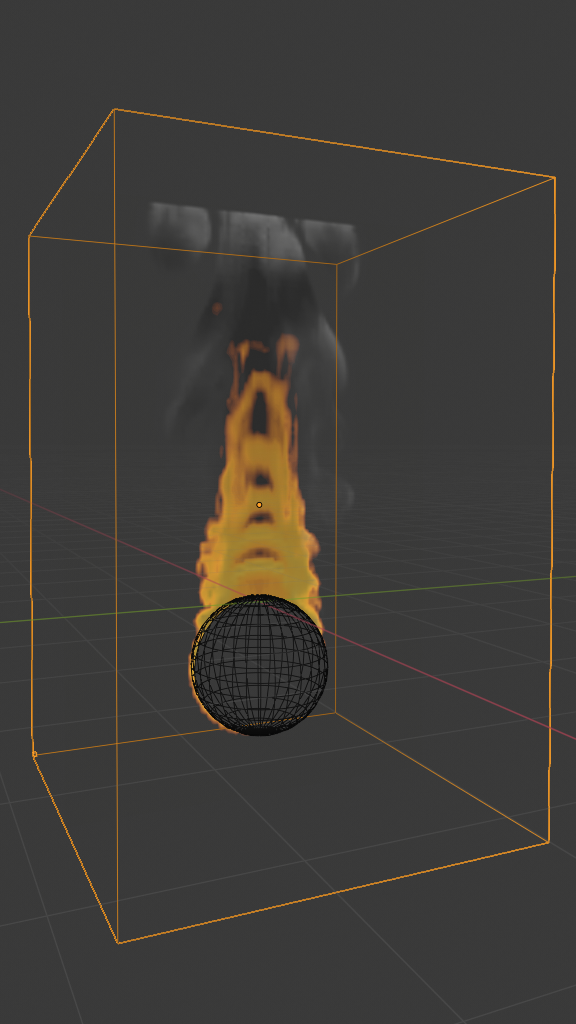
Slice view of «fire» grid without color mapping.
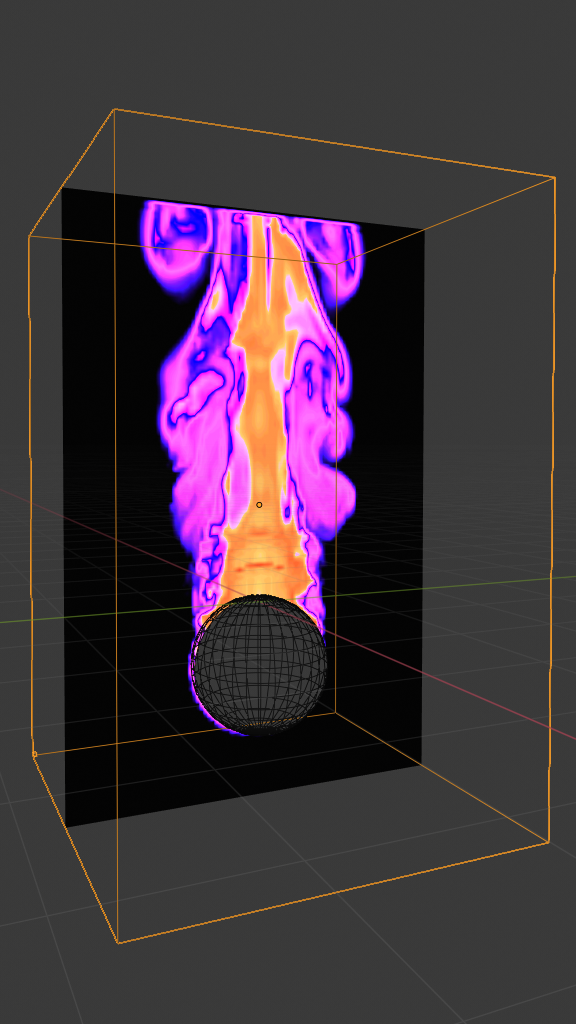
Slice view of «fire» grid with color mapping.
- Escala
Scale the selected simulation field by this value.
Vector Display
Visualization options for the vector fields.
- Mostrar Como
- Streamlines
Choose to display the vectors as «Streamlines».
- Needle
Choose to display the vectors as «Needles».
- MAC Grid
Choose to display the vector field as «Marker-And-Cell Grid».
- X/Y/Z
Show an individual X/Y/Z component of the MAC grid.
- Magnitude Streamlines or Needle Only
Scale the display vectors by the magnitude of the vectors they represent.
- Field
The vector field represented by the display vectors (e.g. fluid velocity, external forces).
- Escala
Scale the vectors by this size in the viewport.
Advanced Gridlines Only
Advanced coloring options for gridlines.
- Color Gridlines
- Flags
Color gridlines with flags.
- Highlight Range Grid Display Only
Highlight the cells with values of the displayed grid within the range. Values between the Lower Bound and Upper Bound (inclusive) are considered to be within the range.
- Lower Bound
Lower bound of the highlighting range.
- Upper Bound
Upper bound of the highlighting range.
- Color
Color used to highlight the cells.
- Cell Type
Choose to highlight only a particular type of cells.