Scopes
Scopes in the image editor.
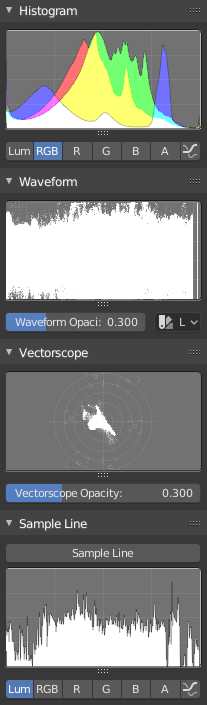
Histogramme
This mode displays a graph showing the distribution of color information in the pixels of the currently displayed image. The X axis represents values of pixel, from 0 to 1 (or 0 to 255), while the Y axis represents the number of pixels in that tonal range. A predominantly dark image would have most of its information toward the left side of the graph.
Use this mode to balance out the tonal range in an image. A well balanced image should have a nice smooth distribution of color values.
- Luma
Affiche la luminosité d’une image.
- RGB
Affiche les canaux RGB empilés l’un sur l’autre.
- R/G/B/A
Selon le canal que vous choisissez, le contexte va afficher le canal approprié.
- Show line
Displays lines rather than filled shapes.
Waveform
- Waveform Opacity
Opacité des points.
- Waveform Mode
- Luma
ToDo.
- Parade
Les canaux RVB sont affichés côte à côte.
- Red Green Blue
Shows the RGB channels overlaid as a « Full color » waveform. It is useful for color grading.
Vectorscope
- Vectorscope Opacity
Opacité des points.
Sample Line
The Sample Line scope is the same as the Histogram but allows you to get the sample data from a line.
- Sample Line
Utilisé pour tracer une ligne à utiliser pour lire les données d’échantillon.
Scope Samples
- Full Sample
Échantillonner chaque pixel.
- Accuracy
Proportion of original image source pixel lines to sample.