はじめに
The Graph Editor allows users to adjust animation curves over time for any animatable property. F-Curves.
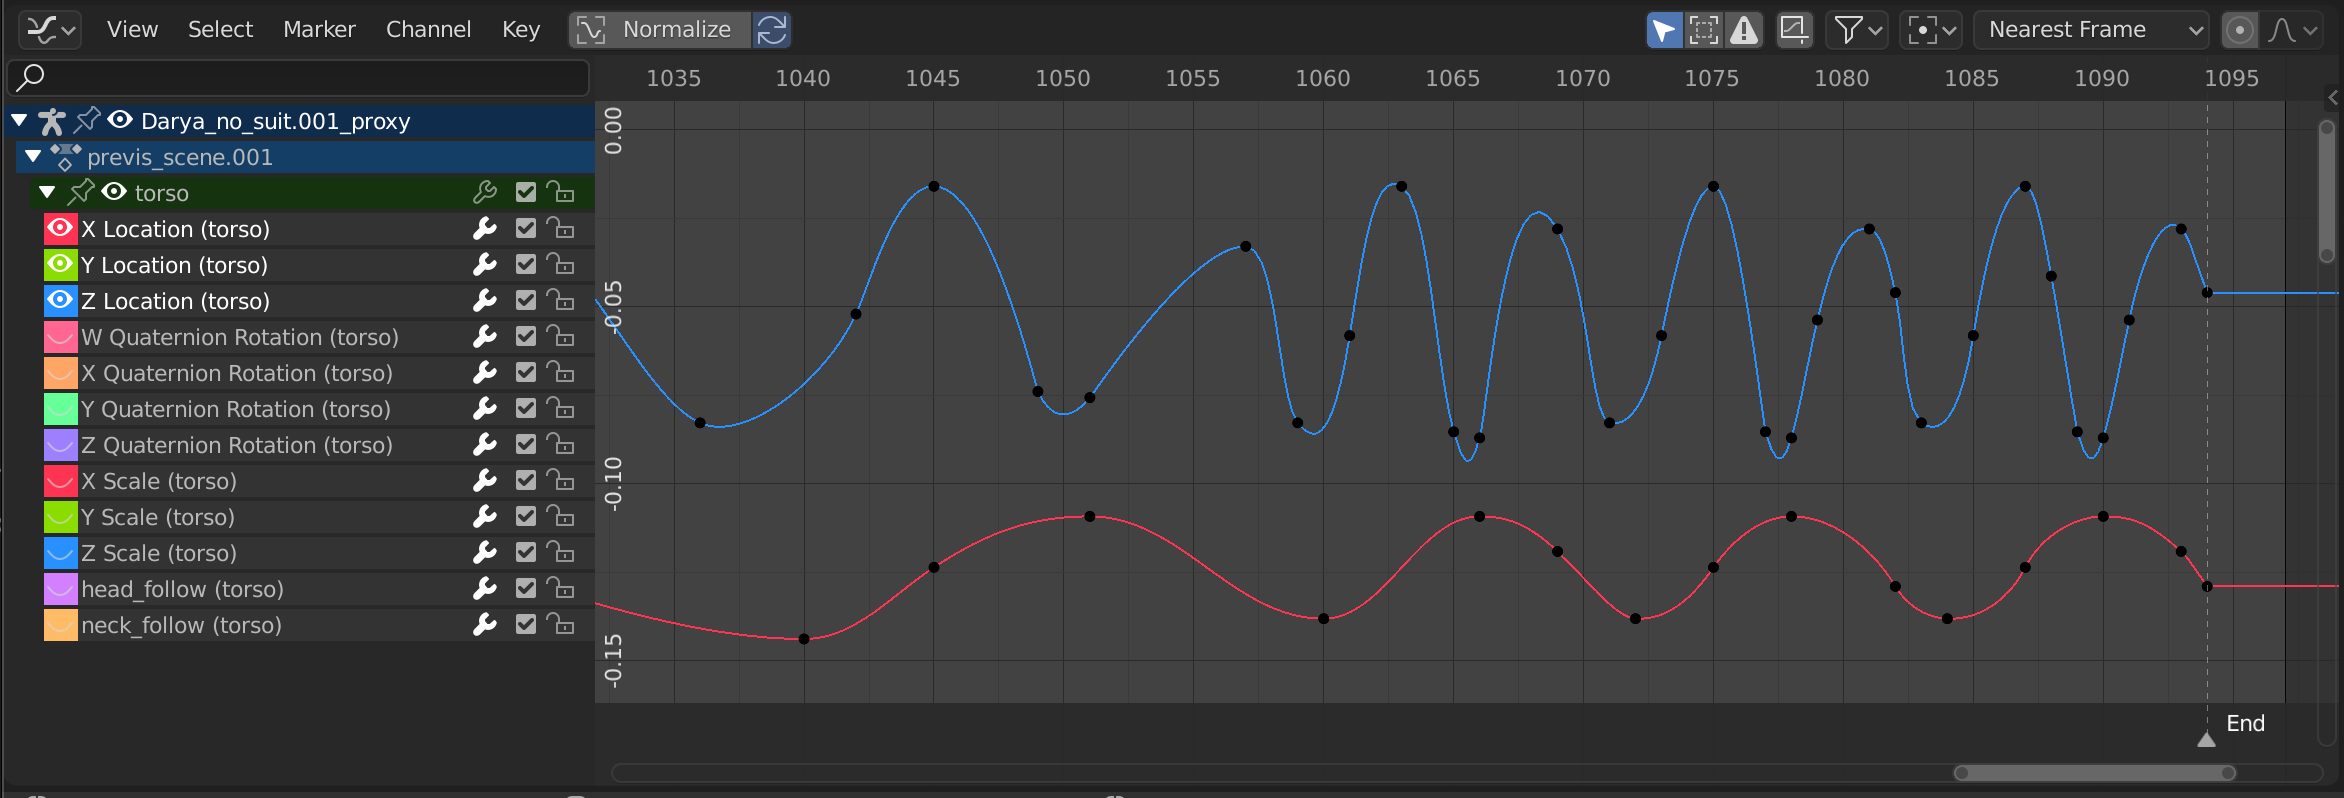
Graph Editor(グラフエディター)。
メイン領域
The curve view allows you to view and edit F-Curves. An F-Curve has several key parts:
- Curve(カーブ)
The curve defines the value (Y axis) of the property over time (X axis).
See F-Curves.
- Keyframes(キーフレーム)
Keyframes are user-defined values on certain frames and are represented by little black squares which become orange if selected.
See Keyframes for more information.
- Handles(ハンドル)
Each keyframe has a handle that helps determine the values of the curve between keyframes. These handles are represented by extruding lines with circular ends and can be selected and modified to change the shape of the curve.
See F-Curve Handles for more information.
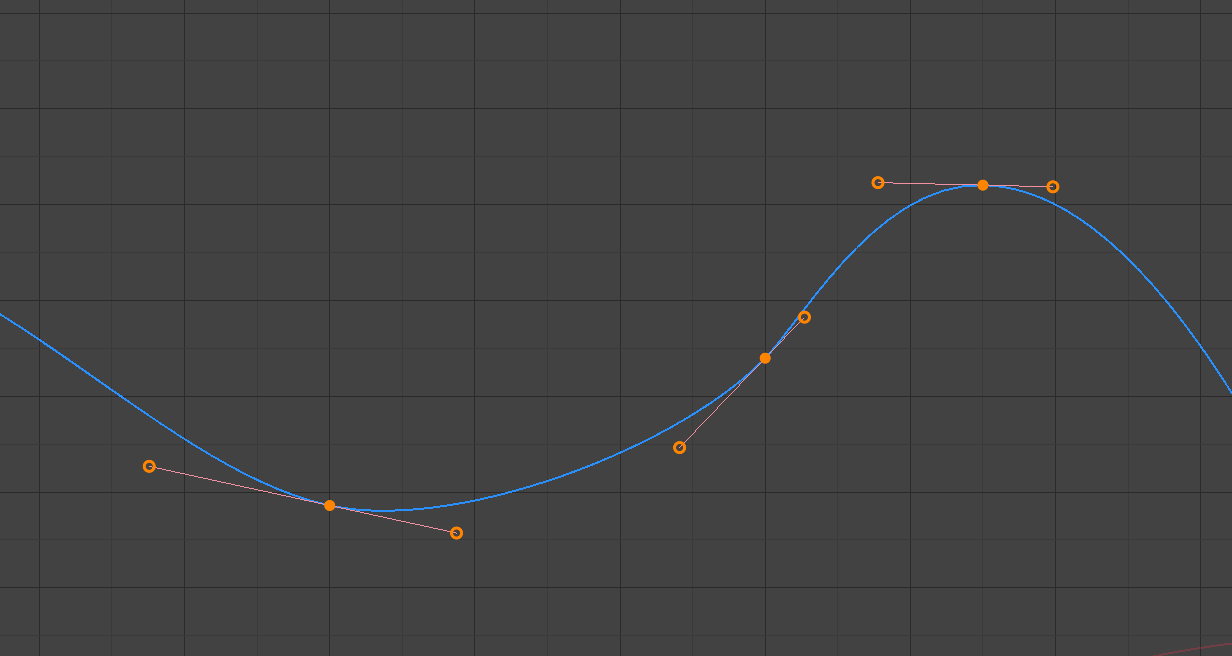
A simple curve.
参考
詳細は F-Curves(Fカーブ) を参照してください。
Playhead & 2D Cursor(2Dカーソル)
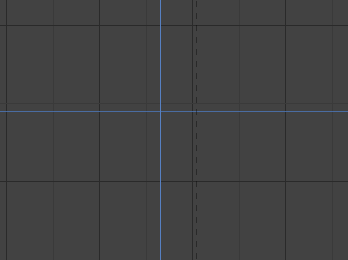
Graph Editor(グラフエディター) 2D Cursor(2Dカーソル)。
The current frame is represented by a blue vertical line called the Playhead.
As in the Timeline, you can change the current frame by LMB-dragging in the scrubbing area at the top of the editor.
The blue horizontal line is called the 2D Cursor. This can be enabled or disabled via the View Menu or the View Properties panel.
These two lines can be used as a reference for moving and scaling keyframe handles.
参考
See Graph Editor's View(ビュー) タブ.
View Axes
For Actions the X axis represents time, the Y axis represents the value to set the property.
Depending on the selected curves, the values have different meaning: for example rotation properties are shown in degrees.
ヘッダー
Markers Menu
Markers(マーカー) は、アニメーションの中での重要な意味を持つフレームやイベントを示すものです。ほとんどのアニメーションエディタと同様に、Marker(マーカー) はエディタの下部に表示されます。
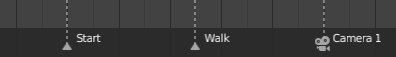
アニメーションエディターの Marker(マーカー)。
For descriptions of the different marker tools see Editing Markers.
ビューコントロール
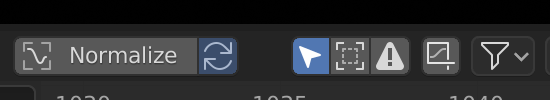
ビューコントロール。
- Show Only Selected(選択物のみ表示)
Only include curves related to the selected objects and data.
- Show Hidden(非表示を表示)
Include curves from objects/bones that are not visible.
- Show Only Errors(エラーのみ表示)
Only include curves and drivers that are disabled or have errors. Useful for debugging.
- フィルター (漏斗アイコン)
Only include curves with keywords contained in the search field.
- Multi-Word
Fuzzy/Multi-Word name filtering matches word snippets/partial words, instead of having to match everything. It breaks down the search text based on whitespace placement. e.g. "lo ro" will filter all location and rotation, while "lc rt" will not work.
- Type Filter
プロパティタイプでカーブをフィルタリングします。
- Filtering Collection(コレクションのフィルタリング)
Select a collection to only show keyframes from objects contained in that collection.
- Sort Data-Blocks(データブロックをソート)
Objects data-blocks appear in alphabetical order, so that it is easier to find where they occur (as well as helping to keep the animation of related objects together in the NLA for instance).
If you find that your playback speed suffers from this being enabled (it should only really be an issue when working with lots of objects in the scene), you can turn this off.
- Normalize(正規化)
Normalize curves so the maximum or minimum point equals 1.0 or -1.0.
- Auto(自動)
Automatically recalculate curve normalization on every curve edit. This is useful to prevent curves from jumping after tweaking it.
F-Curve Controls
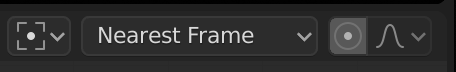
F-Curve controls.
- Proportional Editing(プロポーショナル編集) O
Proportional Editing(プロポーショナル編集) を参照してください。
- Auto Snap
Auto snap the keyframes for transformations.
No Auto-Snap
Frame Step
Second Step
Nearest Frame
Nearest Second
Nearest Marker(近接するマーカー)
- Pivot Point(ピボットポイント)
Pivot point for rotation.
- Bounding Box Center(バウンディングボックスの中心)
Center of the selected keyframes.
- 2D Cursor(2Dカーソル)
Center of the 2D Cursor. Playhead + Cursor.
- Individual Centers(それぞれの原点)
Rotate the selected keyframe Bézier handles.
- Create Ghost Curves (framed F-Curve icon)
Creates a picture with the current shape of the curves.
Sidebar(サイドバー) 領域
The panels in the Sidebar region.
View(ビュー) タブ
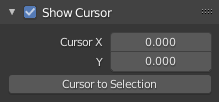
View(ビュー) タブ。
- Show Cursor(カーソルを表示)
Toggles the visibility of the 2D Cursor.
- Cursor(カーソル) X, Y
Moves the cursor to the specified frame (X value) and value (Y value).
- Cursor to Selection(カーソル → 選択物)
Places the 2D Cursor at the midpoint of the selected keyframes.
参考
Graph Editor's View(ビュー) メニュー.
Further Tabs
- F-Curve(Fカーブ) タブ
See F-Curve.
- Modifiers(モディファイアー) タブ
F-Curve Modifiers(Fカーブモディファイアー) を参照してください。