Graph View – Огляд «Граф»

Огляд «Граф» – Graph View.
Introduction – Вступ
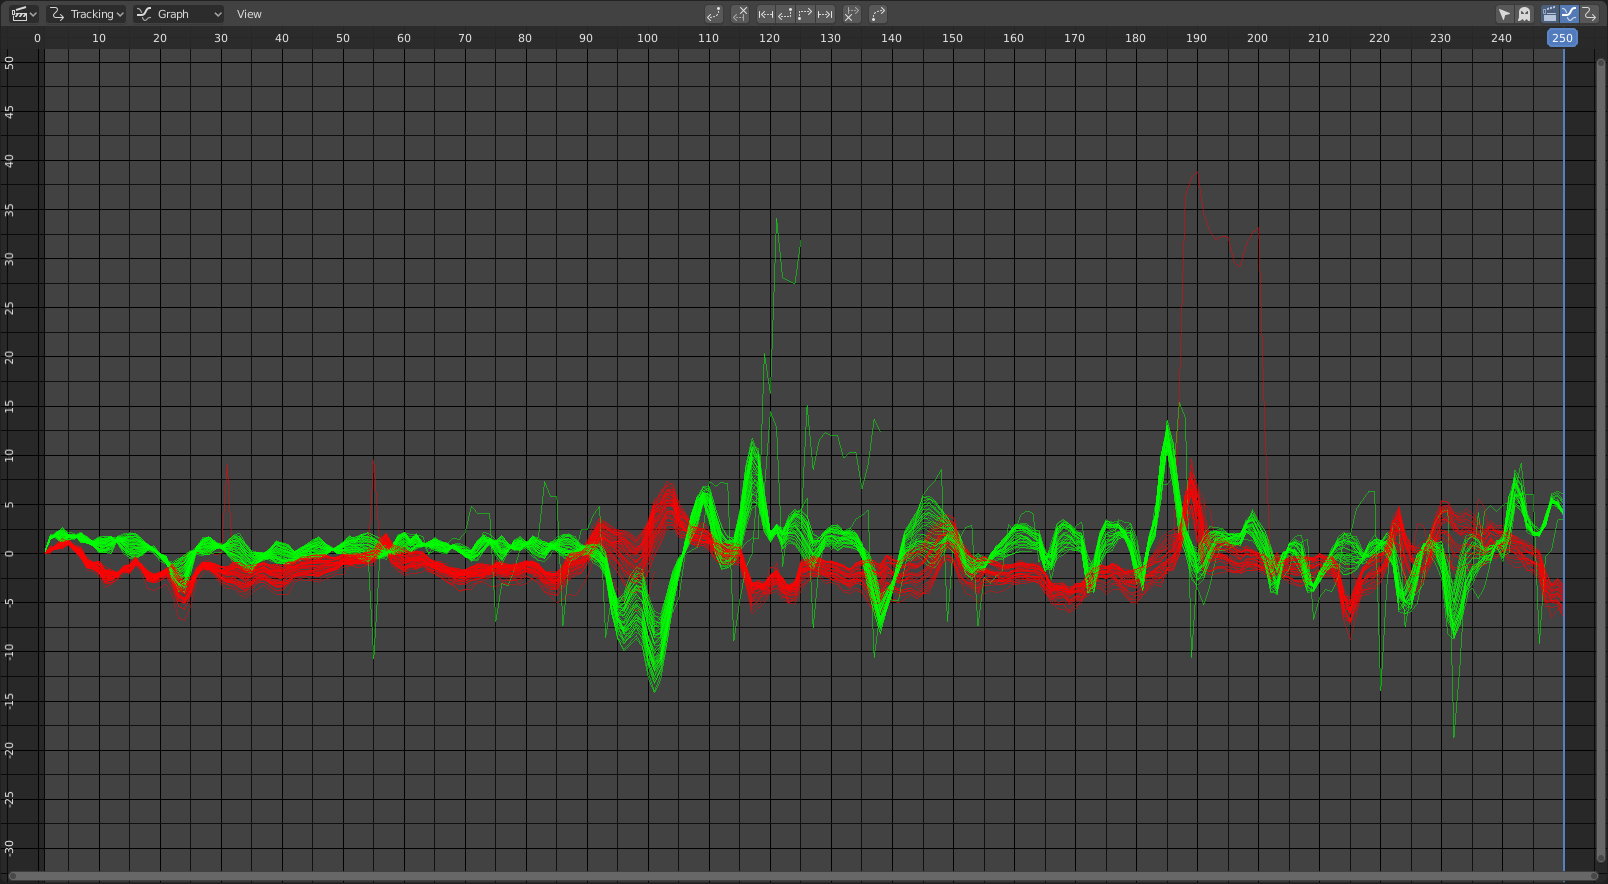
The graph or curves view has numerous purposes based on the color of the lines. The red and green lines on the graph show you the speed of the trackers at a given frame. Green is vertical movement, Red is horizontal. Therefore the first frames will always be at zero.
The blue line is the line that comes out when you click on the film strip is the average per-frame error. This curve is available only after pressing camera solve and is not editable. This is the one line that you want to be as flat as possible and as closer to zero as you can. The high points will show you where in your shot you are having inaccurate tracking.
Кадри поза діапазоном кадрів сцени затемняються.
Header – Заголовок
- Показ Вибране – Show Selected (іконка вказівника миші)
Показує граф лише для вибраних відстежників.
- Показ Сховане – Display Hidden (ghost icon)
Показує канали з об’єктів, що сховані.
- Filter – Фільтр
Опції показу, визначає, які криві видимі.
- Frames – Кадри
Візуалізує усереднену помилку репроектування по кадрах для всіх стежок в активному об’єкті відстеження.
- Рух – Motion
Показує криві для швидкості стежок по X та Y.
- Помилка – Error
Покадрова помилка репроектування стежок.
Використання – Usage
The curves are useful to see if particular trackers are moving differently than the average. A line that spikes from the rest of the curve usually means a tracking error.
Ви можете вручну редагувати криву, вибираючи потрібну точку на ній та перетягуючи або видаляючи її, що буде давати відповідний впливу на відповідний відстежник у певному кадрі.
- Lock to Selection L
Locks the view to selected markers during playback.