Planilla
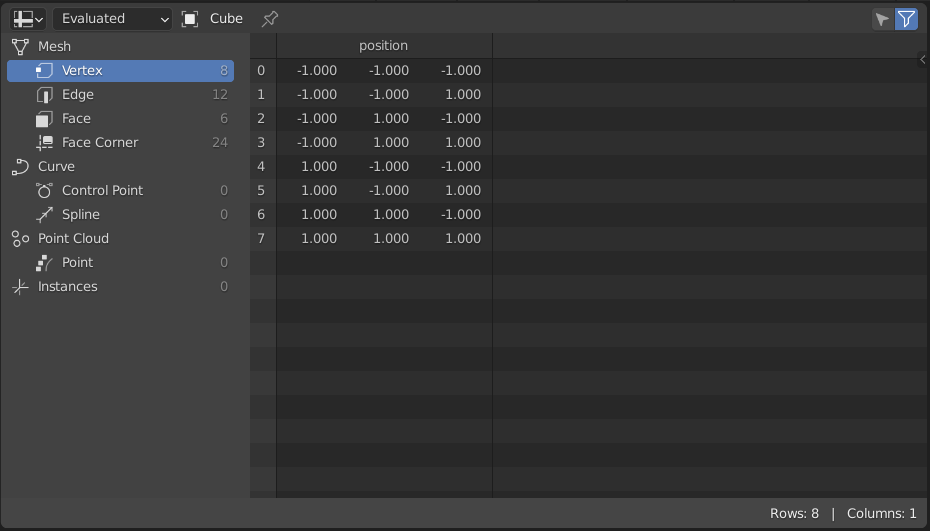
The Spreadsheet editor is used to inspect geometry attributes.

El editor Planilla.
Encabezado
- Estado de evaluación del objeto
Display the data of an object at different states of its evaluation.
- Evaluado:
Muestra datos del objeto con todos los modificadores aplicados.
- Original:
Muestra datos del objeto original sin aplicar ningún modificador.
- Nodo Visor:
Display data from the active Viewer node of the active object.
- Migas de pan
The breadcrumbs show three key parts of the path the evaluated object takes before showing the information in the Main Region. In the order from left to right, the first item displayed is the Active object. The next two items are displayed when the Viewer node evaluation state is chosen. The first of these next items is the name of the Geometry Nodes modifier, the last item shown is the name of the active Viewer node.
Clicking the arrow between items hides the name of the active modifier.
- Alternador Fijar
Usually, the editor displays data from the active object. When an object is pinned, its data remains visible, even if another object becomes active.
- Sólo seleccionado
This option is only available if the object is in Edit Mode. When checked, only data for the selected mesh elements is shown.
Región principal
The main view allows you to view the actual spreadsheet. Row indices and column names remain visible when scrolling down or to the side.
Nota
Byte color attributes are displayed as scene linear floats. The actual byte values are displayed in a tooltip when hovering over the float values.
Región del conjunto de datos
With the Data Set region on the left you can choose which geometry component and geometry domain to view. For each attribute domain its size is displayed, for example the number of faces.
- Malla
Mesh component containing point, corner, face and edge data.
- Vértice:
Display attributes that are stored per vertex.
- Borde:
Display attributes that are stored per edge.
- Cara:
Display attributes that are stored per face.
- Esquina de cara:
Display attributes that are stored per face corner.
- Curva
Display curve data which are the attributes on splines and control points.
- Punto de control:
Display attributes that are stored per control point.
- Curva:
Display attributes that are stored per spline.
- Nube de puntos
Point cloud component containing only point data.
- Punto (o Apuntar):
Display attributes that are stored per point.
- Volume Grids
Display OpenVDB volume grid data, each grid will be represented with the Grid Name, the Data Type, and the Class. The class can be either of: Fog Volume, Level Set, or Unknown.
- Instancias
Display which objects and collections are instanced and their transforms.
Barra de estado
The status bar shows how many rows and columns there are and how many have been filtered out.