Blender 3.3 Manual Logo

Prise en main

  • À propos de Blender
  • Installation de Blender
  • Configuration de Blender
  • Système d’aide

Sections

  • User Interface
  • Éditeurs
    • 3D Viewport
    • Image Editor
      • Introduction
      • Navigation
      • Sidebar (Barre Latérale)
        • Outil
        • Image
          • Image
          • Metadata
        • View Tab
          • Affichage
          • Annotations
        • Scopes
          • Histogram
          • Waveform
          • Vectorscope
          • Sample Line
          • Scope Samples
      • Overlays
      • Paramètres d’image
      • Édition
    • Éditeur UV
    • Compositor
    • Les nœuds Texture
    • Éditeur de nœud de géométrie
    • Éditeur Shader
    • Video Sequencer
    • Éditeur Movie Clip
    • Dope Sheet
    • Timeline
    • Éditeur Graph
    • Drivers Editor (Editeur de Pilotes)
    • Non-linear Animation (Animation Non-linéaire)
    • Éditeur de texte
    • La Console de Python
    • Éditeur Info
    • Outliner
    • Properties
    • File Browser
    • Asset Browser (Navigateur d’assets)
    • Spreadsheet
    • Preferences
  • Scènes et objets
  • Modeling
  • Sculpture et peinture
  • Grease Pencil
  • Animation et rigging
  • Physics
  • Rendering (rendu)
  • Composition
  • Motion Tracking & Masking
  • Montage vidéo
  • Assets, Fichiers et Système de données
  • Add-ons (modules supplémentaires)
  • Avancé
  • Diagnostic des anomalies
  • Glossaire

Impliquez-vous

  • Contribuer à la documentation
Blender 3.3 Manual
  • »
  • Éditeurs »
  • Image Editor »
  • Sidebar (Barre Latérale)

Sidebar (Barre Latérale)

Outil

Affiche les paramètres de l’outil actif.

Image

Image

Tools for working with images, see Paramètres d’image.

Metadata

Liste les métadonnées de l’image.

View Tab

Affichage

You can set the editors display options in this panel.
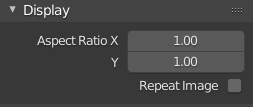
../../_images/editors_image_sidebar_panel.png

Panneau Display.

Aspect Ratio

Display Aspect for this image. Does not affect rendering.

Repeat Image

Duplicate the image until it is repeated to fill the main view.

Annotations

Options de l’outil d’annotation. Voir Annotations.

Scopes

../../_images/editors_image_sidebar_scopes.png

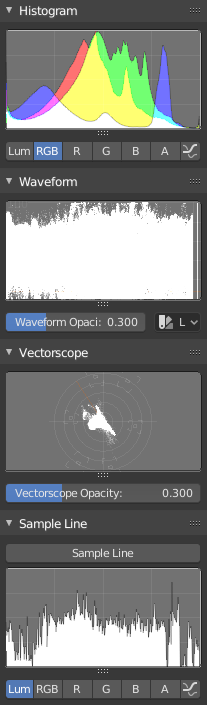
Scopes in the Image editor.

Histogram

This mode displays a graph showing the distribution of color information in the pixels of the currently displayed image. The X axis represents values of pixel, from 0 to 1 (or 0 to 255), while the Y axis represents the number of pixels in that tonal range. A predominantly dark image would have most of its information toward the left side of the graph.

Utilisez ce mode pour équilibrer la gamme de tons d’une image. Une image bien équilibrée doit présenter une distribution régulière des valeurs de couleur.

Luma

Shows the luminosity of an image.

RGB

Affiche les canaux RGB empilés les uns sur les autres.

R/G/B/A

Depending on the channel you choose the scope will show the appropriate channel.

Show Line

Affiche des lignes plutôt que des formes remplies.

Waveform

Waveform Opacity

Opacité des points.

Waveform Mode
Luma

ToDo.

YCbCr

ToDo.

Parade

The RGB channels are shown side-by-side.

Red Green Blue

Shows the RGB channels overlaid as a « Full color » waveform. It is useful for color grading.

Vectorscope

Vectorscope Opacity

Opacité des points.

Sample Line

Le scope Sample Line est le même que celui de l'Histogram, mais vous permet d’obtenir les échantillons de données à partir d’une ligne.

Sample Line

Used to draw a line to use to read the sample data from.

Scope Samples

Full Sample

Échantillonne chaque pixel.

Accuracy

Proportion of original image source pixel lines to sample.

Précédent Suivant

© Copyright : This page is licensed under a CC-BY-SA 4.0 Int. License. Mis à jour le 10/02/2024.

  • Edit Page
  • Rapporter un problème dans cette page
  • 3.3
    Versions
    • Loading...
  • fr
    Languages
    • Loading...