Thanh Bên (Sidebar)
Công Cụ (Tool)
Hiển thị các cài đặt của công cụ đang hoạt động.
Hình Ảnh (Image)
Hình Ảnh (Image)
Tools for working with images. See Các Sắp Đặt về Hình Ảnh (Image Settings).
Siêu Dữ Liệu (Metadata)
Liệt kê siêu dữ liệu của hình ảnh.
Góc Nhìn (View)
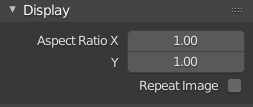
Hiển Thị (Display)
You can set the editor's display options in this panel.

Bảng hiển thị.
- Tỷ Lệ Tương Quan (Aspect Ratio)
Display aspect for this image. Does not affect rendering.
- Nhắc Lại Hình Ảnh (Repeat Image)
Tile the image so it completely fills the editor.
Chú Thích (Annotations)
Các tùy chọn về công cụ chú thích. Xin xem mục Chú Thích (Annotations).
Kế Đo Lường (Scopes)

Scopes in the Image Editor.
Displays different kinds of statistical information about the colors in the image.
Note that the Scopes tab is not shown if the active object is in Edit Mode or Texture Paint Mode.
Biểu Đồ Tần Xuất (Histogram)
Displays a graph of the color distribution in the image. For each color value (such as Luminance) on the X axis, it shows the number of pixels with that value on the Y axis. A predominantly dark image would have the highest values toward the left side of the graph.
Sử dụng chế độ này để cân bằng phạm vi âm sắc trong hình ảnh. Một hình ảnh cân bằng tốt phải có sự phân bố các giá trị màu sắc mượt mà.
You can drag LMB in the histogram to adjust its vertical zoom.
- Độ Sáng (Luma)
Shows a luminosity histogram.
- Red, Green, Blue: Đỏ, Lục, Lam
Hiển thị các kênh RGB được xếp chồng lên nhau.
- R/G/B/A
Shows a single color channel.
- Hiển Thị Nét (Show Line)
Hiển thị các đường nét thay vì các hình có bề mặt phủ kín.
Hình Sóng (Waveform)
Plots the color distribution for each vertical line of pixels in the image. The X axis of the Waveform corresponds to the X axis of the image, while the Y axis represents the range of a color component such as Luminance. The brighter a specific point is, the more pixels in that vertical line have that color value.
- Độ Đục của Hình Sóng (Waveform Opacity)
Độ Đục của các điểm.
- Chế Độ Hình Sóng (Waveform Mode)
- Độ Sáng (Luma)
Show a single Waveform plotting the luminosity distribution.
- YCbCr
Show the Y, Cb and Cr Waveforms side by side.
- Diễu Hành (Parade)
Show the R, G and B Waveforms side by side.
- Đỏ Lục Lam (Red Green Blue)
Show the R, G and B Waveforms overlaid on top of each other.
Véctơ Kế (Vectorscope)
Shows the color distribution in a radial fashion. The angle represents the hue, while the distance from the center represents the saturation.
- Độ Đục của Véctơ Kế (Vectorscope Opacity)
Độ Đục của các điểm.
Lấy Mẫu Vật về Đường Vẽ (Sample Line)
Kế đo lường "Lấy Mẫu Vật về Đường Vẽ" cũng giống như Histogram (Biểu Đồ Tần Xuất)` nhưng cho phép bạn lấy mẫu dữ liệu từ một đường vẽ.
- Lấy Mẫu Vật về Đường Vẽ (Sample Line)
Used to draw a line to read the sample data from.
Lượng Mẫu Vật (Samples)
- Lấy Mẫu Vật Toàn Phần (Full Sample)
Lấy mẫu từng điểm ảnh.
- Độ Chính Xác (Accuracy)
Proportion of image pixels to sample if Full Sample is disabled.