Sidebar(サイドバー)
Tool(ツール)
アクティブなツールの設定を表示します。
Image(画像)
Image(画像)
Tools for working with images. See 画像の設定.
Metadata(メタデータ)
画像のメタデータをリストします。
View(ビュー)
Display(表示)
You can set the editor's display options in this panel.
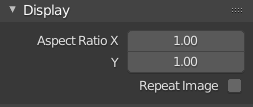
Display(表示) パネル。
- Aspect Ratio(アスペクト比)
Display aspect for this image. Does not affect rendering.
- Repeat Image(画像をリピート)
Tile the image so it completely fills the editor.
Annotations(アノテーション)
アノテーション ツールのオプション。 Annotations(アノテーション) を参照してください。
Scopes(スコープ)
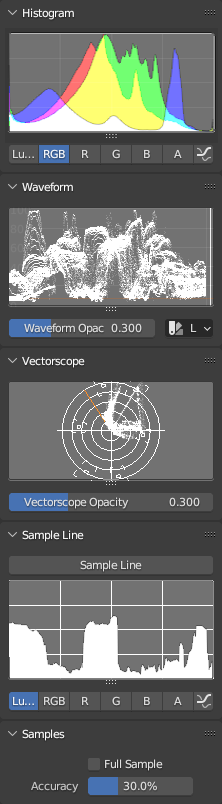
Scopes in the Image Editor.
Displays different kinds of statistical information about the colors in the image.
Note that the Scopes tab is not shown if the active object is in Edit Mode or Texture Paint Mode.
Histogram(ヒストグラム)
Displays a graph of the color distribution in the image. For each color value (such as Luminance) on the X axis, it shows the number of pixels with that value on the Y axis. A predominantly dark image would have the highest values toward the left side of the graph.
このモードを使用して、画像の色調範囲のバランスを調整します。バランスの取れた画像は、色の値がスムーズに分布していなければなりません。
You can drag LMB in the histogram to adjust its vertical zoom.
- Luma(輝度)
Shows a luminosity histogram.
- RGB
互いに積み上げられた RGB チャネルを表示します。
- R/G/B/A
Shows a single color channel.
- Show Line(行を表示)
塗りつぶされた形状ではなく、線を表示します。
Waveform(波形)
Plots the color distribution for each vertical line of pixels in the image. The X axis of the Waveform corresponds to the X axis of the image, while the Y axis represents the range of a color component such as Luminance. The brighter a specific point is, the more pixels in that vertical line have that color value.
- Waveform Opacity(波形の不透明度)
ポイントの不透明度です。
- Waveform Mode(ウェーブフォーム)
- Luma(輝度)
Show a single Waveform plotting the luminosity distribution.
- YCbCr
Show the Y, Cb and Cr Waveforms side by side.
- Parade(パレード)
Show the R, G and B Waveforms side by side.
- Red Green Blue(赤緑青)
Show the R, G and B Waveforms overlaid on top of each other.
Vectorscope(ベクトルスコープ)
Shows the color distribution in a radial fashion. The angle represents the hue, while the distance from the center represents the saturation.
- Vectorscope Opacity(ベクタースコープの不透明度)
ポイントの不透明度です。
Sample Line(サンプルライン)
サンプルライン の範囲は Histogram(ヒストグラム) と同じであるが、ラインからサンプルデータを取得することができます。
- Sample Line(サンプルライン)
Used to draw a line to read the sample data from.
Samples(サンプル数)
- Full Sample(フルサンプル)
すべてのピクセルをサンプリングします。
- Accuracy(精度)
Proportion of image pixels to sample if Full Sample is disabled.