Spreadsheet
The Spreadsheet editor is used to inspect the geometry attributes of the active object, typically in order to debug geometry nodes.
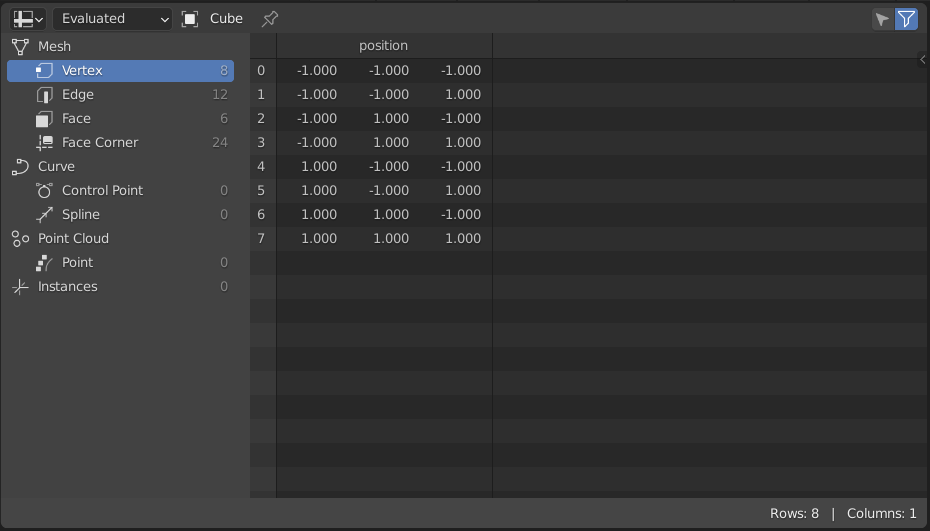
The Spreadsheet editor.
Header
- Show Only Selected
This option is only available if the object is in Edit Mode. When checked, only data for the selected geometry elements is shown.
- Use Filter
Whether to use the filters that are defined in the Sidebar (see below).
Main Region
The main region displays the attribute data in a spreadsheet format. Each column corresponds to an attribute or data property, and each row represents an element such as a vertex, face, spline, or instance.
Column names and row indices remain visible while scrolling both vertically and horizontally.
Columns can be resized by clicking and dragging the vertical line between columns.
Double clicking the vertical line automatically sizes the column to fit the content.
Columns can be reordered by clicking and dragging the column header.
Muista
Tooltips give more detail about the value, depending on the type. For example, Byte Color attributes are displayed as scene linear floats, but the actual integer values are displayed when hovering over the float values, and Matrix attribute values are only displayed in tooltips.
Data Set Region
Located on the left, this region controls which data is displayed in the spreadsheet.
Context Path
Displays the active object name in the panel header.
Clicking one of the arrows between the names to hide the modifier.
Clicking the icon locks the Spreadsheet editor to the currently active object and data path, keeping it visible even if you select another object. Click again to unlock.
- Object Evaluation State
Defines which state of the object’s data is displayed:
- Evaluated:
Shows data with all modifiers applied.
- Original:
Shows the original object data, without modifiers.
- Viewer Node:
Displays data from the active Viewer Node in Geometry Nodes.
You can also toggle between Evaluated and Viewer Node by clicking the / icon in the Viewer node’s header.
Viewer Path
Visible when Object Evaluation State is set to Viewer Node.
Shows the path from the modifier to the active viewer node. If the viewer node is nested inside group nodes, each group will appear in the path.
Viewer Data
Visible when Object Evaluation State is set to Viewer Node.
Specifies which Viewer Items from the active Viewer node is displayed in the Spreadsheet Editor.
When a Viewer node outputs multiple data sets (for example, geometry and one or more evaluated fields), each of these appears as a separate Viewer Item. This setting allows choosing which item to display, such as a specific attribute, value field, or geometry component, without changing the Viewer node connection itself.
Muista
The available viewer items depend on the currently active Viewer node and its connected inputs. Changing the active viewer or modifying its connections will update this list automatically.
Geometry
Lets you browse nested geometries (e.g., a mesh inside an instance or a geometry collection).
Domain
Lets you choose the attribute domain to display, such as mesh vertices or curve splines.
The number of elements in each domain is shown next to its entry.
Volume Grids
When the selected geometry component is a Volume, the Spreadsheet displays detailed information about each grid contained in the volume. Each grid represents a single data field, such as density, color, or velocity, and can be inspected individually to understand its structure and memory usage.
The following information is shown for each grid:
Grid Name – The name of the grid data, such as density or temperature.
Data Type – The type of data stored in the grid, for example Float, Vector, or Boolean.
Class – The grid class, describing its purpose or usage, such as Fog Volume, Level Set, or Unknown.
Voxel Extent – The grid’s bounding box in voxel coordinates. Shows the number of voxels in the X, Y, and Z directions.
Min Voxel – The minimum voxel coordinates of the grid’s bounding box. This represents the lowest X, Y, and Z voxel indices occupied by the grid, indicating where the grid begins in voxel space.
Voxels – The total number of active voxels in the grid. This includes all voxels that are explicitly stored, even when contained in tiles (e.g., a single leaf tile contains 512 voxels).
Leaf Voxels – The number of active voxels stored in leaf nodes. Unlike Voxels, this count excludes voxels that belong to higher-level tiles.
Tiles – The number of active tiles in the grid. Tiles are higher-level voxel containers used by sparse volume formats (like OpenVDB) to optimize storage.
Size – The estimated memory size of the grid, including all voxel and tile data currently allocated.
These statistics make it possible to analyze the complexity, density, and performance cost of volumetric data produced by Geometry Nodes or imported volume files.
Muista
Since volume grids use a sparse data structure, the Extent can be much larger than the actual number of active voxels. Only active regions of the grid are stored in memory, which keeps volume data efficient even for large domains.
Status Bar
The status bar shows how many rows and columns there are, and how many rows remain after filtering.