侧栏#
工具#
显示活动工具的设置。
图像#
图像#
处理图像的工具。详见 图像设置。
元数据#
列出图像元数据。
视图#
显示#
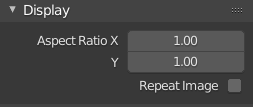
可以在此面板中设置编辑器的显示选项。

显示面板。#
- 宽高比
显示此图像的宽高比。不影响渲染。
- 重复图像
平铺图像使其完全填充编辑器。
标注#
标注工具选项。参见 标注。
示波器#

图像编辑器中的示波器。#
Displays different kinds of statistical information about the colors in the image.
Note that the Scopes tab is not shown if the active object is in Edit Mode or Texture Paint Mode.
直方图#
Displays a graph of the color distribution in the image. For each color value (such as Luminance) on the X axis, it shows the number of pixels with that value on the Y axis. A predominantly dark image would have the highest values toward the left side of the graph.
使用此模式可平衡图像中的色调范围。均衡良好的图像应具有平滑的颜色值分布。
You can drag LMB in the histogram to adjust its vertical zoom.
- 亮度
显示亮度直方图。
- RGB
显示彼此堆叠的 RGB 通道。
- R/G/B/A
显示单个颜色通道。
- 显示线型
显示线条而不是填充的形状。
波形图#
Plots the color distribution for each vertical line of pixels in the image. The X axis of the Waveform corresponds to the X axis of the image, while the Y axis represents the range of a color component such as Luminance. The brighter a specific point is, the more pixels in that vertical line have that color value.
- 波形图不透明度
点的不透明度。
- 波形图模式
- 亮度
Show a single Waveform plotting the luminosity distribution.
- YCbCr
Show the Y, Cb and Cr Waveforms side by side.
- 检阅
Show the R, G and B Waveforms side by side.
- 红,绿,蓝
Show the R, G and B Waveforms overlaid on top of each other.
矢量示波图#
Shows the color distribution in a radial fashion. The angle represents the hue, while the distance from the center represents the saturation.
- 矢量示波图不透明度
点的不透明度。
采样线#
采样线 示波图和 直方图 一样,但允许从一条线中获得采样数据。
- 采样线
Used to draw a line to read the sample data from.
采样#
- 全采样
对每个像素采样。
- 精度
Proportion of image pixels to sample if Full Sample is disabled.