Introdução
The Graph Editor lets you edit animation curves, which determine how properties change over time.
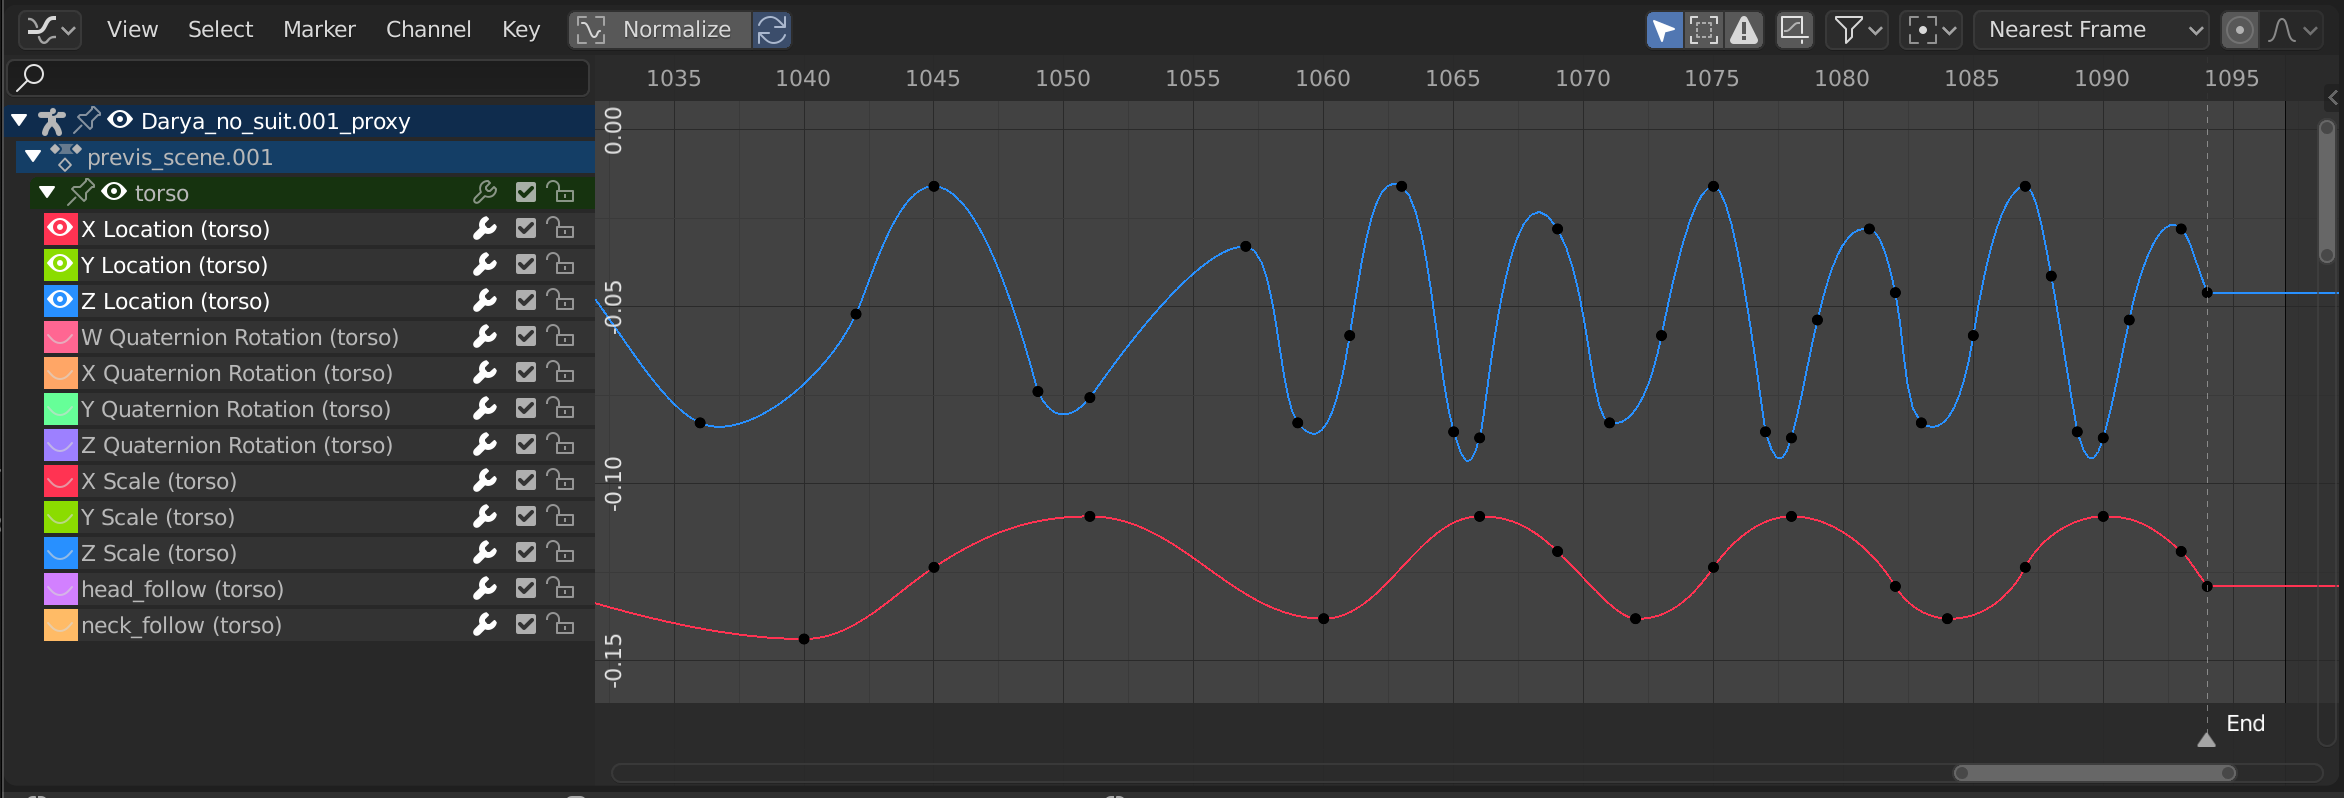
O Editor gráfico.
Região principal
The curve view allows you to view and edit F-Curves. An F-Curve has several key parts:
- Curve
The curve describes how the value of a property (Y axis) evolves over time (X axis).
- Keyframes
Keyframes are user-defined values on certain frames and are represented by little black discs that become orange when selected. The values on the other frames are calculated automatically by interpolating between these keyframes.
- Handles
Each keyframe has two handles – points that can be dragged around to influence the shape of the curve around it.
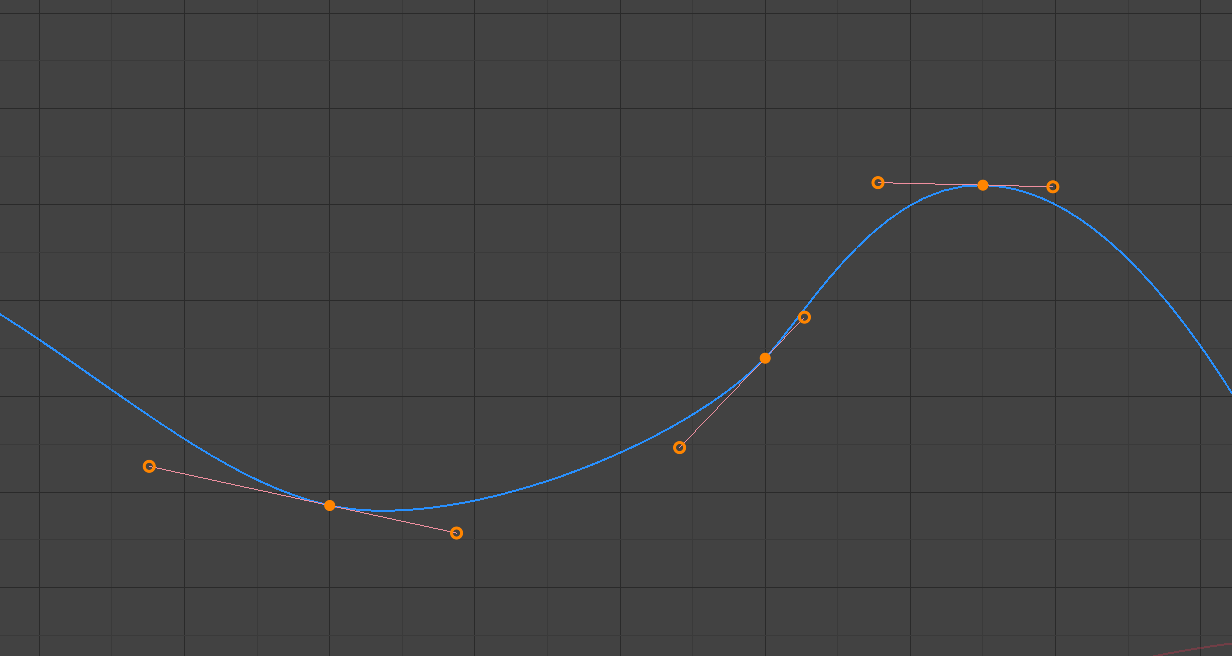
A simple curve. The discs are keyframes, and the circles are their handles.
Veja também
See F-Curves for more info.
Playhead & 2D Cursor
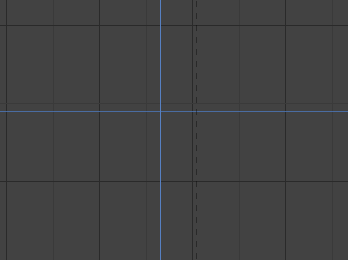
O cursor 2D do editor gráfico.
The current frame is represented by a vertical blue line called the Playhead. Like other Animation Editors, you can move it by clicking or dragging with LMB in the scrubbing area at the top.
Combined with the horizontal blue line, the Playhead forms the 2D Cursor which can be used as a pivot point for rotating and scaling. You can disable the horizontal line using or .
The 2D Cursor can be moved by clicking or dragging with Shift-RMB or by adjusting its coordinates in the View tab of the Sidebar.
Header
View Menu
- Sidebar N
Shows or hides the Sidebar Region.
- Adjust Last Operation
Displays a pop-up panel to alter properties of the last completed operation. See Adjust Last Operation.
- Canais
Shows or hides the Channels Region.
- Playback Controls
Show or hide the Playback Controls.
- Frame Selected NumpadPeriod
Pans and zooms the view to focus on the selected keyframes.
- Frame All Home
Pans and zooms the view to show all keyframes.
- Frame Scene/Preview Range
Reset the horizontal view to the current scene frame range, taking the preview range into account if it is active.
- Go to Current Frame Numpad0
Centers the area to the Playhead.
- Atualizações em tempo real
Whether to update other views (such as the 3D Viewport) while you’re moving keyframes around. If disabled, the other views only get updated once you finish the move.
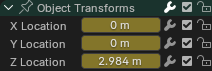
Sliders.
- Mostrar deslizadores
Shows a value slider next to each channel. Adjusting such a slider automatically creates a keyframe.
- Auto-Merge Keyframes
Automatically merge keyframes that end up on the same frame after transformation.
- Auto-Lock Key Axis
Automatically locks the movement of keyframes to the axis that best matches the direction of the mouse cursor.
- Show Markers
Shows the marker region. When disabled, the Marker Menu is also hidden and marker operators are not available in this editor.
- Mostrar o cursor
Toggles the visibility of the horizontal blue line (see Playhead & 2D Cursor).
- Use Timecode Ctrl-T
Show timing in seconds instead of frames. As an example, the timestamp
01:03+02means «1 minute, 3 seconds, 2 frames.»- Sync Visible Range
Synchronizes the horizontal panning and scale of the editor with other time-based editors that also have this option enabled. That way, they always show the same section of time.
- Show Extrapolation
Toggles the visibility of the extrapolated portion of curves.
- Mostrar hastes Ctrl-H
Toggles the display of keyframe handles.
- Somente as hastes dos quadros-chave selecionados
Only shows the handles for the selected keyframes.
- Definir o espaço de previsão P
Lets you drag a box to define a time range for previewing. As long as this range is active, playback will be limited to it, letting you repeatedly view a segment of the animation without having to manually rewind each time.
You can change the start or end frame using the corresponding button in the Timeline editor’s Playback popover. Alternatively, you can simply run Set Preview Range again.
- Clear Preview Range Alt-P
Limpa o espaço marcado para previsão.
- Set Preview Range to Selected Ctrl-Alt-P
Applies a preview range that encompasses the selected keyframes.
- Toggle Dope Sheet
Changes the area’s editor to the Dope Sheet Editor.
- Area
Area controls. See the user interface documentation for more information.
Marker Menu
Markers are used to denote frames with key points or significant events within an animation. Like with most animation editors, they’re shown at the bottom.
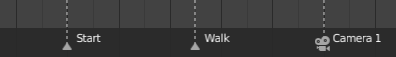
Markers in animation editor.
For descriptions of the different marker tools, see Editing Markers.
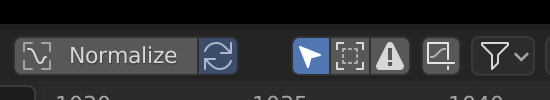
Normalizar
Scales the display of each curve so that they all (appear to) occupy the same value range, going from -1 to 1. This can make editing easier when you’re working with curves whose value ranges are far apart.
When you enable this option, the view is zoomed accordingly and the area outside the normalized value range is darkened.
If a preview range is defined, keyframes within the range are normalized, while the others are scaled proportionally.
Auto Normalization
Automatically recalculate curve normalization on every curve edit.
Controles de visualização
View controls.
- Show Only Selected
Only show curves belonging to objects/bones/… that are selected.
- Show Hidden
Show keyframes from objects/bones/… that are hidden.
- Show Only Errors
Only show channels that have errors (for example, because they try to animate a property that doesn’t exist on the object).
- Create Ghost Curves (framed F-Curve icon)
Creates a snapshot of the current curves and shows it in the background so that you can use it as a reference. Click the button again to clear the snapshot.
- Filter (funnel icon)
- Procurar
Filters the channel list by a search term.
- Filtering Collection
Select a collection to only show keyframes from objects in that collection.
- Filter by Type
Filtra as curvas pelos tipos de propriedades.
- Sort Data-Blocks
Sorts data-blocks alphabetically to make them easier to find.
If your playback speed suffers because of this (should only really be an issue when working with lots of objects), you can turn it off.
Transform Controls
Transform controls.
- Pivot Point
Pivot point for rotating and scaling.
- Centro da caixa circundante
Center of the smallest possible box around the selected keyframes.
- Cursor 2D
The intersection between the Playhead and the horizontal Cursor line.
- Centros individuais
Rotate/scale each handle around its keyframe.
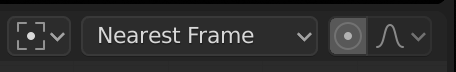
- Snap
The icon toggles snapping on or off. The dropdown offers the following options:
- Snap To
Type of element to snap to.
- Quadro:
Snap to full frames.
- Second:
Snap to seconds.
- Marcadores mais próximos:
Snap to the nearest Marker.
- Absolute Time Snap
When disabled, keyframes will move in increments of Snap To. For example, if you selected Second and have a keyframe that’s currently on 0:06+5, dragging it to the right will snap it to 0:07+5. Its time increases by a second, and its subsecond offset of 5 frames remains the same.
When enabled, keyframes will snap to multiples of Snap To. Taking the above example, the keyframe would snap to 0:07+0, removing the subsecond offset.
- Edição proporcional O
See Proportional Editing.
Playback Controls
The Playback Controls region contains controls and options related to playback, keying, auto keyframing, and transport.
These settings allow you to:
Control how animations are previewed and synchronized with audio.
Insert and manage keyframes through keying sets and auto keying.
Navigate the timeline using playback and transport controls.
Adjust frame ranges and preview specific segments of the animation.
Veja também
For a detailed description of all properties and controls commonly found in the footer, see the Playback Controls documentation.
Sidebar Region
Visualizar (aba)
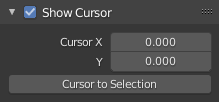
View Tab.
- Mostrar o cursor
Toggles the visibility of the 2D Cursor’s horizontal line.
- Cursor X, Y
Shows, and lets you change, the X coordinate (current frame) and Y coordinate (value) of the 2D Cursor.
- Cursor to Selection
Places the 2D Cursor at the average time and value of the selected keyframes.
- Cursor Value to Selection
Places the 2D Cursor at the average value of the selected keyframes, leaving its time unchanged.
Abas - Curvas-F
See F-Curve Properties.
Modificadores (aba)
See F-Curve Modifiers.