Sidebar
Tool
Displays the settings of the active tool.
Image
Image
Tools for working with images. See Image Settings.
Metadata
Lists image metadata.
View
Display
You can set the editor’s display options in this panel.
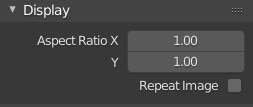
Display panel.
- Aspect Ratio
Display aspect for this image. Does not affect rendering.
- Repeat Image
Tile the image so it completely fills the editor.
Annotations
Options for the annotation tool. See Annotations.
Scopes
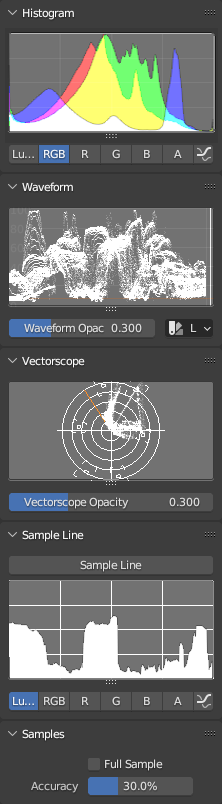
Scopes in the Image Editor.
Displays different kinds of statistical information about the colors in the image.
Note that the Scopes tab is not shown if the active object is in Edit Mode or Texture Paint Mode.
Histogram
Displays a graph of the color distribution in the image. For each color value (such as Luminance) on the X axis, it shows the number of pixels with that value on the Y axis. A predominantly dark image would have the highest values toward the left side of the graph.
Use this mode to balance out the tonal range in an image. A well-balanced image should have a nice smooth distribution of color values.
You can drag LMB in the histogram to adjust its vertical zoom.
- Luma
Shows a luminosity histogram.
- RGB
Shows the RGB channels stacked on top of each other.
- R/G/B/A
Shows a single color channel.
- Show Line
Displays lines rather than filled shapes.
Waveform
Plots the color distribution for each vertical line of pixels in the image. The X axis of the Waveform corresponds to the X axis of the image, while the Y axis represents the range of a color component such as Luminance. The brighter a specific point is, the more pixels in that vertical line have that color value.
- Waveform Opacity
Opacity of the points.
- Waveform Mode
- Luma
Show a single Waveform plotting the luminosity distribution.
- YCbCr
Show the Y, Cb and Cr Waveforms side by side.
- Parade
Show the R, G and B Waveforms side by side.
- Red Green Blue
Show the R, G and B Waveforms overlaid on top of each other.
Vectorscope
Shows the color distribution in a radial fashion. The angle represents the hue, while the distance from the center represents the saturation.
- Vectorscope Opacity
Opacity of the points.
Sample Line
The Sample Line scope is the same as the Histogram but allows you to get the sample data from a line.
- Sample Line
Used to draw a line to read the sample data from.
Samples
- Full Sample
Sample every pixel.
- Accuracy
Proportion of image pixels to sample if Full Sample is disabled.