Display Mode
Using this pop-up, you can choose between displaying the preview image or a scope that visualizes its color distribution.
Image Preview
Previews what the final video will look like, and lets you change the image layout using various tools.
Luma Waveform
This scope visualizes the luminosity (brightness) distribution of the image, letting you see at a glance if there’s enough contrast and if any areas are under- or overexposed.
The scope works by plotting a curve for each scanline in the current video frame. Another way of saying this is that each pixel column in the luma waveform is a brightness histogram of the corresponding pixel column in the frame. Specifically:
The horizontal position of a pixel in the waveform refers to a pixel column in the frame.
The vertical position of a pixel in the waveform refers to a brightness value, going from 0 at the bottom to 1 at the top.
The brightness of a pixel in the waveform indicates how many pixels in the above frame column have the above brightness. If no pixels in the frame column have this brightness, the waveform pixel is black. If at least three pixels in the frame column have this brightness, the waveform pixel is white.
The examples below show two images and their corresponding luma waveforms.
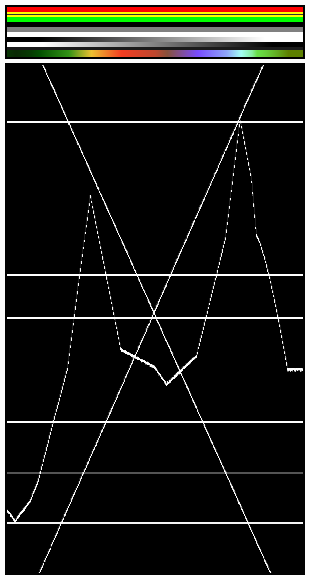
The various horizontal lines in the luma waveform match the uniform-colored lines of the picture. Note that the ‘gray 20%’ one-pixel width line (inside the yellow strip) is represented in the Luma waveform by a gray line. The two lines drawing an “X” are from the two monochrome gradients. Finally, the broken line matches the colored gradient at the bottom.¶ |
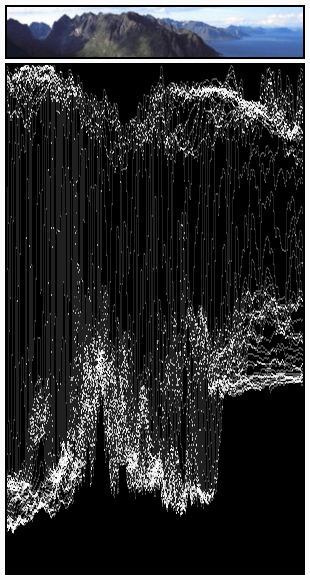
The curves are quite visible. We found a luma of 80-100% for the sky, a luma around 40% for the sea, and a luma of 10-20% for the mountains, growing around 40% for the sunny part.¶ |
RGB Parade
Shows three waveforms – for the red, green, and blue color channels – instead of just one for the overall image brightness.
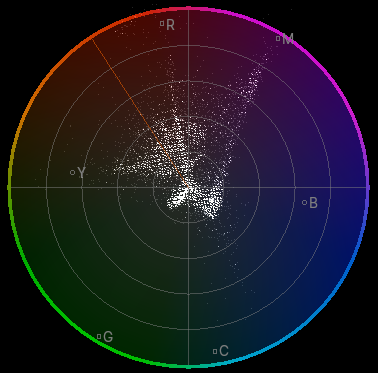
Chroma Vectorscope
This scope visualizes the color distribution of the image. Each point has:
An angle indicating its hue.
A distance-from-center indicating its saturation.
A brightness indicating how many pixels in the video frame have the above hue and saturation.
Histogram
Shows three overlapping graphs, one for each color channel. Within each graph:
The X axis corresponds to color intensity, going from 0 on the left (black) to 1 on the right (fully red/green/blue).
The Y axis corresponds to number of pixels.
Use this mode to balance out the tonal range in an image. A well-balanced image should have nice and smooth distribution of color values.
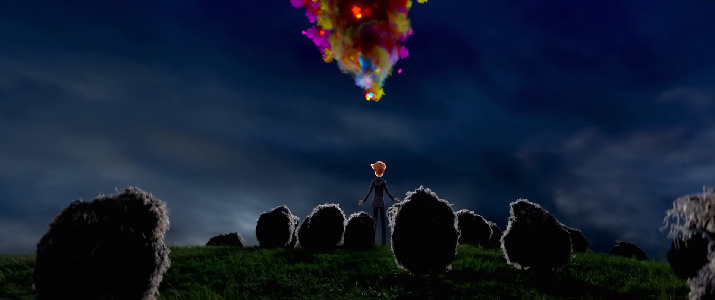
Example image.
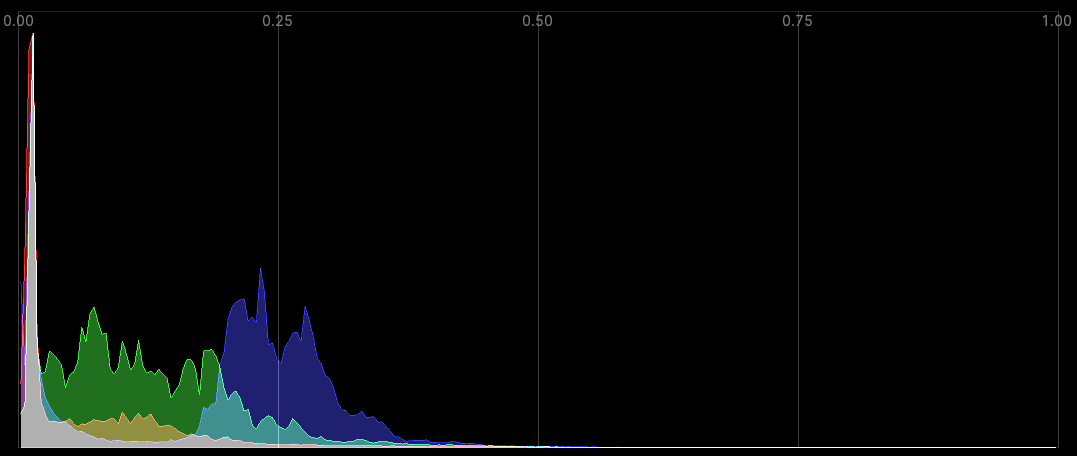
Corresponding Histogram.