Spreadsheet
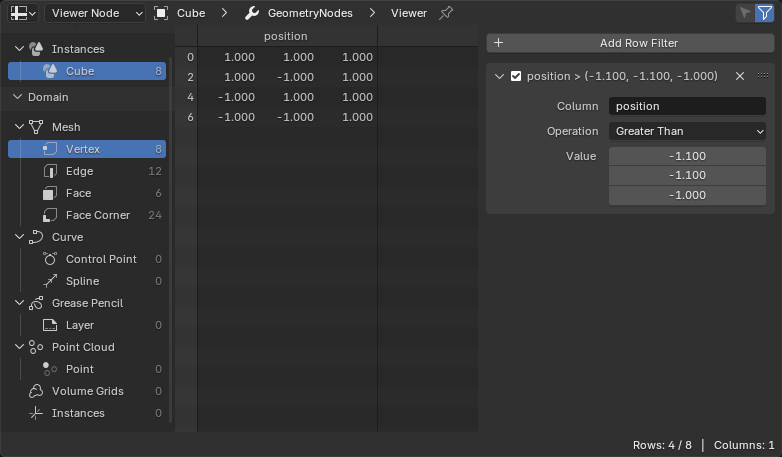
The Spreadsheet editor is used to inspect the geometry attributes of the active object, typically in order to debug geometry nodes.

The Spreadsheet editor.
헤더(header)
- Object Evaluation State
The state for which to display data.
- Evaluated:
Display data from the object with all modifiers applied.
- Original:
Display data from the original object without any modifiers applied.
- Viewer Node:
Display the data that’s fed into the active Viewer Node.
You can also toggle between Evaluated and Viewer Node by clicking the eye icon in the Viewer node’s header.
- Breadcrumbs
Shows the name of the active object, and (if Object Evaluation State is set to Viewer Node) the name of the Geometry Nodes modifier and the active Viewer node.
You can click one of the arrows between the names to hide the modifier.
- Toggle Pin
Click to “lock” the editor to the currently active object, and have it keep displaying that object’s data even if another object becomes active. Click again to unlock.
- Selected Only
This option is only available if the object is in Edit Mode. When checked, only data for the selected geometry elements is shown.
- Use Filter
Whether to use the filters that are defined in the Sidebar (see below).
주요 부분(main region)
The main view shows the actual spreadsheet. Column names and row indices remain visible when scrolling down or to the side.
참고
Tooltips give more detail about the value, depending on the type. For example, Byte Color attributes are displayed as scene linear floats, but the actual integer values are displayed when hovering over the float values, and Matrix attribute values are only displayed in tooltips.
Data Set Region
With region on the left, you can choose what to display data for. The top tree lets you pick from the hierarchy of geometries, such as a mesh inside an instance. The bottom tree lets you pick a domain, such as mesh vertices or curve splines.
Each tree item shows the number of elements inside.
Status Bar
The status bar shows how many rows and columns there are, and how many rows remain after filtering.