Sidebar – Бічносмуга
Tool – Засіб
Показує устави активного засобу.
Image – Зображення
Image – Зображення
Tools for working with images. See Image Settings – Устави Зображення.
Metadata – Метадані
Перелічує метадані зображення.
View – Огляд
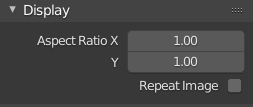
Display – Показ
You can set the editor’s display options in this panel.

Панель Display – «Показ».
- Aspect Ratio – Пропорція Аспекту
Display aspect for this image. Does not affect rendering.
- Repeat Image – Повтор Зображення
Tile the image so it completely fills the editor.
Annotations – Анотації
Опції для засобу анотації. Дивіться Annotations – Анотації.
Scopes – Розглядпростори

Scopes in the Image Editor.
Displays different kinds of statistical information about the colors in the image.
Note that the Scopes tab is not shown if the active object is in Edit Mode or Texture Paint Mode.
Histogram – Гістограма
Displays a graph of the color distribution in the image. For each color value (such as Luminance) on the X axis, it shows the number of pixels with that value on the Y axis. A predominantly dark image would have the highest values toward the left side of the graph.
Використовуйте цей режим для збалансування тонального діапазону в зображенні. Добре збалансоване зображення повинно мати гарний плавний розподіл значень кольорів.
You can drag LMB in the histogram to adjust its vertical zoom.
- Luma – Світність
Shows a luminosity histogram.
- RGB
Показує канали RGB, накладені один поверх одного.
- R/G/B/A
Shows a single color channel.
- Show Line – Показ Лінії
Показує лінії, а не заповнені форми.
Waveform – Хвилеформа
Plots the color distribution for each vertical line of pixels in the image. The X axis of the Waveform corresponds to the X axis of the image, while the Y axis represents the range of a color component such as Luminance. The brighter a specific point is, the more pixels in that vertical line have that color value.
- Waveform Opacity – Безпрозорість Хвилеформи
Безпрозорість точок хвилеформи.
- Waveform Mode – Режим Хвилеформи
- Luma – Світність
Show a single Waveform plotting the luminosity distribution.
- YCbCr
Show the Y, Cb and Cr Waveforms side by side.
- Parade – Парад
Show the R, G and B Waveforms side by side.
- Red Green Blue – Червоне Зелене Синє
Show the R, G and B Waveforms overlaid on top of each other.
Vectorscope – Вектороскоп
Shows the color distribution in a radial fashion. The angle represents the hue, while the distance from the center represents the saturation.
- Vectorscope Opacity – Безпрозорість Вектороскопа
Безпрозорість точок хвилеформи.
Sample Line – Вибірка Лінії
Розглядпростір Sample Line подібний на гістограму Histogram, але дозволяє вам отримувати відібрані дані із заданої лінії.
- Sample Line – Вибірка Лінії
Used to draw a line to read the sample data from.
Samples – Вибірки
- Full Sample – Повна Вибірка
Вибірка по кожному пікселю.
- Accuracy – Точність
Proportion of image pixels to sample if Full Sample is disabled.