Введение
The Graph Editor lets you edit animation curves, which determine how properties change over time.

The Graph Editor.
Основная область
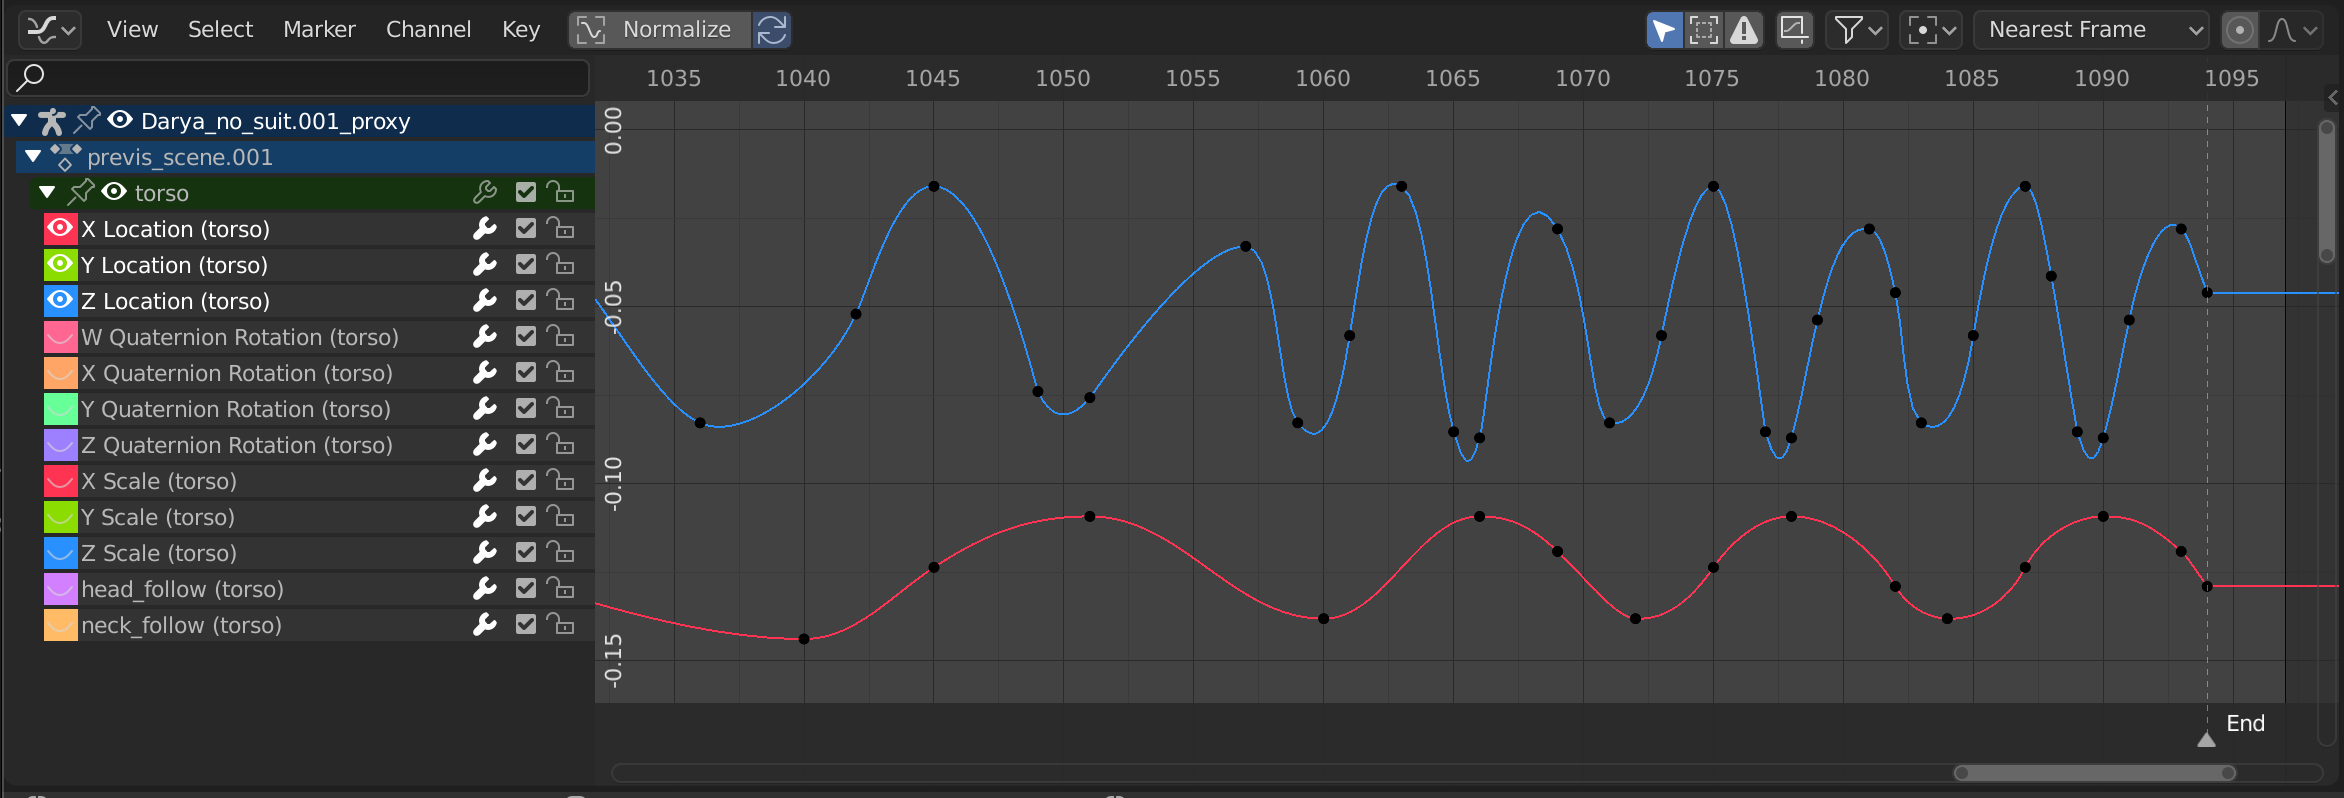
The curve view allows you to view and edit F-Curves. An F-Curve has several key parts:
- Кривая (curve)
The curve describes how the value of a property (Y axis) evolves over time (X axis).
- Кейфреймы
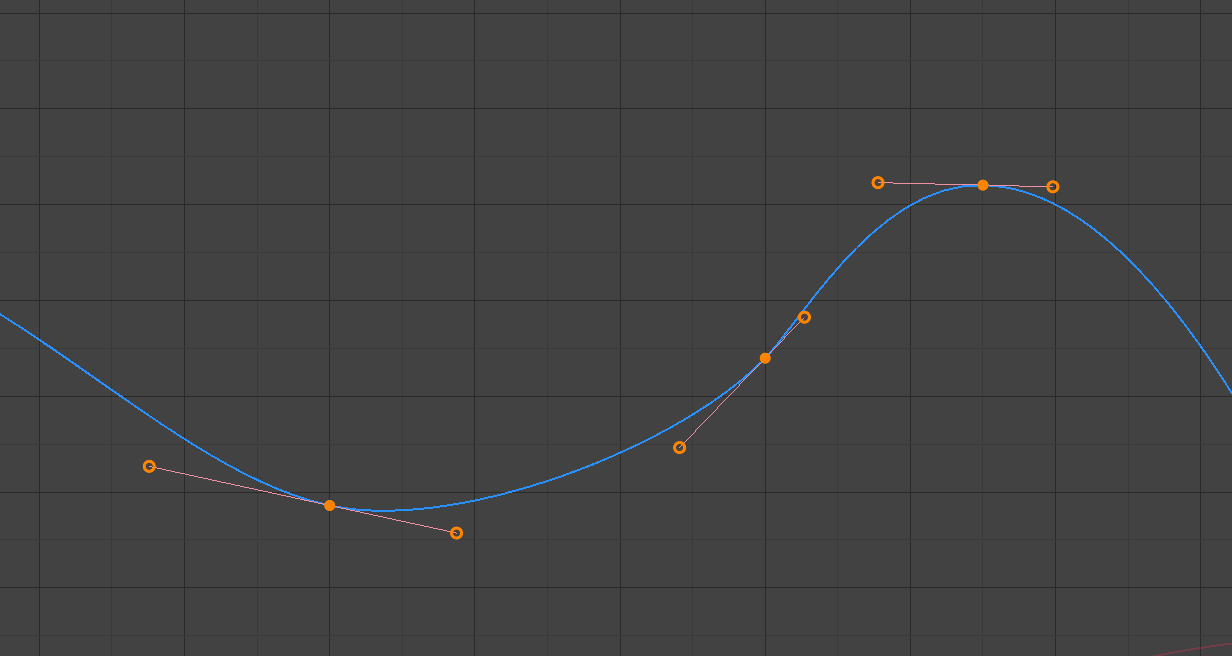
Keyframes are user-defined values on certain frames and are represented by little black discs that become orange when selected. The values on the other frames are calculated automatically by interpolating between these keyframes.
- Ручки
Each keyframe has two handles – points that can be dragged around to influence the shape of the curve around it.

A simple curve. The discs are keyframes, and the circles are their handles.
См. также
See F-Curves for more info.
Playhead & 2D Cursor

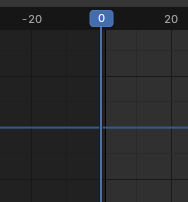
Graph Editor 2D Cursor.
The current frame is represented by a vertical blue line called the Playhead. As in the Timeline, you can move it by clicking or dragging with LMB in the scrubbing area at the top.
Combined with the horizontal blue line, the Playhead forms the 2D Cursor which can be used as a pivot point for rotating and scaling. You can disable the horizontal line using or .
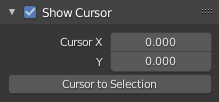
The 2D Cursor can be moved by clicking or dragging with Shift-RMB or by adjusting its coordinates in the View tab of the Sidebar.
Колонтитул
Нормализовать (normalize)
Scales the display of each curve so that they all (appear to) occupy the same value range, going from -1 to 1. This can make editing easier when you’re working with curves whose value ranges are far apart.
When you enable this option, the view is zoomed accordingly and the area outside the normalized value range is darkened.
If a preview range is defined, keyframes within the range are normalized, while the others are scaled proportionally.
Автонормализация (auto normalization)
Automatically recalculate curve normalization on every curve edit.
View Controls

View controls.
- Show Only Selected
Only show curves belonging to objects/bones/… that are selected.
- Show Hidden
Show keyframes from objects/bones/… that are hidden.
- Show Only Errors
Only show channels that have errors (for example, because they try to animate a property that doesn’t exist on the object).
- Create Ghost Curves (framed F-Curve icon)
Creates a snapshot of the current curves and shows it in the background so that you can use it as a reference. Click the button again to clear the snapshot.
- Filter (funnel icon)
- Поиск (search)
Filters the channel list by a search term.
- Filtering Collection
Select a collection to only show keyframes from objects in that collection.
- Filter by Type
Filter curves by property type.
- Sort Data-Blocks
Sorts data-blocks alphabetically to make them easier to find.
If your playback speed suffers because of this (should only really be an issue when working with lots of objects), you can turn it off.
Элементы управления трансформации

Преобразование элементов управления (Transform controls).
- Центр трансформации (pivot point)
Точка пивот для вращения и масштабирования.
- Центр габаритного контейнера (bounding box center)
Центр минимально возможного поля вокруг выделенных ключевых кадров.
- 2D-Курсор (2D cursor)
The intersection between the Playhead and the horizontal Cursor line.
- Individual Centers
Rotate/scale each handle around its keyframe.
- Привязать (snap)
Значок включает или выключает привязку. Раскрывающийся список предлагает следующие варианты:
- Привязка к (snap to)
Тип элемента, к которому нужно привязаться.
- Кадр (frame)
Привязка к целым кадрам.
- Второй (second)
Привязка к секундам.
- Ближайший маркер (nearest marker)
Привязка к ближайшему маркеру.
- Привязка к абсолютному времени (absolute time snap)
When disabled, keyframes will move in increments of Snap To. For example, if you selected Second and have a keyframe that’s currently on 0:06+5, dragging it to the right will snap it to 0:07+5. Its time increases by a second, and its subsecond offset of 5 frames remains the same.
When enabled, keyframes will snap to multiples of Snap To. Taking the above example, the keyframe would snap to 0:07+0, removing the subsecond offset.
- Пропорциональное редактирование (proportional editing) O
См.: «Пропорциональное редактирование».


