Табличный редактор (spreadsheet)
Табличный редактор используется для проверки атрибутов геометрии активного объекта, в основном для отладки геометрических нод.
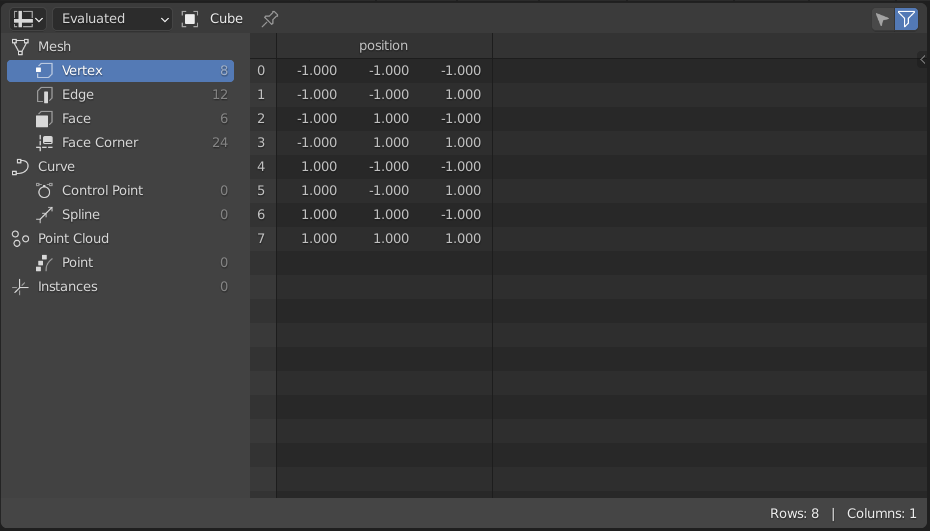
Табличный редактор.
Колонтитул
- Показать только выделенное (show only selected)
Эта опция доступна только в режиме редактирования объекта. Если она активирована (), – будут отображаться только данные для выделенных элементов геометрии.
- Использовать фильтр (use filter)
Позволяет выбрать – использовать ли фильтры, установленные в боковой панели (см. ниже).
Основная область
В основной области отображаются данные атрибутов в формате электронной таблицы. Каждый столбец соответствует атрибуту или свойству данных, а каждая строка представляет элемент, например вершину, грань, сплайн или экземпляр.
Названия столбцов и индексы строк остаются видимыми при прокрутке как по вертикали, так и по горизонтали.
Размер столбцов можно изменять кликом и перетаскиванием вертикальной линии между столбцами.
Двойной щелчок по вертикальной линии автоматически изменяет размер столбца в соответствии с содержимым.
Порядок столбцов можно изменять кликнув и перетащив заголовок столбца.
Примечание
Всплывающие подсказки предоставляют более подробную информацию о значениях в зависимости от типа данных атрибута. Например, атрибуты „Byte Color“ отображаются как числа с плавающей запятой линейного цветового пространства, но при наведении на них курсора – отображаются фактические целочисленные значения, а значения атрибутов „Matrix“ отображаются только во всплывающих подсказках.
Область набора данных
Область, расположенная слева, управляет данными, отображаемыми в табличном редакторе.
Контекстный путь (context path)
Отображает имя активного объекта в заголовке панели.
Щелчок по одной из стрелок между именами – скрывает модификатор.
Щелчок по значку „“ блокирует табличный редактор на текущем активном объекте и пути к данным, сохраняя его видимым даже при выделении другого объекта. Щёлкните ещё раз, чтобы разблокировать.
- Состояние оценки объекта
Позволяет установить отображение состояния данных объекта:
- Вычисленное (evaluated):
Показывает данные со всеми применёнными модификаторами.
- Оригинал (original):
Показывает исходные данные объекта без модификаторов.
- Нода «Предпросмотр» (viewer node):
Отображает данные из активной ноды „Viewer“ в геометрических нодах.
Вы также можете переключаться между режимами отображения между „Evaluated“ и нодой „Viewer“, щелкая значок / в заголовке ноды „Предпросмотра“.
Путь предпросмотра (viewer path)
Видно, когда „состояние оценки объекта“ установлено на „Viewer Node“.
Показывает путь от модификатора к активной ноде предпросмотра. Если нода „Viewer“ является вложенной в групповую ноду, – в пути будет отображаться каждая группа.
Данные предпросмотра (viewer data)
Видно, когда „состояние оценки объекта“ установлено на „Viewer Node“.
Позволяет установить, какой из элементов предпросмотра из активной ноды „Viewer“ будет отображаться в табличном редакторе.
Когда нода „Viewer“ выводит не один набор данных (например, геометрию и одно или несколько оцениваемых полей), каждый из них будет отображаться как отдельный элемент предпросмотра. Данная настройка позволяет выбрать, какой элемент отображать, например, какой-то определённый атрибут, поле значения или компонент геометрии, без изменения самого соединения ноды „Viewer“.
Примечание
Доступные элементы предпросмотра зависят от текущей активной ноды „Viewer“ и подключённых к ней входов. Изменение активной ноды предпросмотра или изменение её соединений будет автоматически обновлять этот список.
Геометрия (geometry)
Позволяет просматривать вложенные геометрии (например, меш внутри экземпляра или коллекцию геометрий).
Домен (domain)
Позволяет выбрать домен атрибутов для отображения, например вершины меша или сплайны-кривые.
Количество элементов в каждом домене указывается рядом с его записью.
Сетки объёма (volume grids)
Когда выделенным геометрическим компонентом является объём, табличный редактор отображает подробную информацию о каждой ячейке сетки, содержащейся в данном объёме. Каждая ячейка сетки представляет собой отдельное поле данных, такое как „density“, „color“ или „velocity“, и может быть проверена отдельно, чтобы понять её структуру и использование памяти.
Для каждой ячейки сетки отображается следующая информация:
Имя сетки (grid name) – Имя для данных сетки, например, „density“ или „temperature“.
Тип данных (data type) – Тип данных, хранящихся в сетке, например, „Float“, „Vector“ или „Boolean“.
Класс (class) – Класс сетки, описывающий её назначение или использование, например, „Fog Volume“, „Level Set“ или „Unknown“.
Протяжённость вокселей (voxel extent) – Габаритный контейнер сетки в воксельных координатах. Отображает количество вокселей по осям „X“, „Y“ и „Z“.
Минимум вокселя (min voxel) – Минимальные координаты вокселя по габаритному контейнеру сетки. Данные значения представляют собой наименьшие индексы вокселей по „X“, „Y“ и „Z“, занимаемые сеткой, и указывают начало сетки в воксельном пространстве.
Воксели (voxels) – Общее количество активных вокселей в сетке. Сюда входят все воксели, которые были сохранены «явно», даже если они находятся в тайлах (например, один листовой тайл содержит 512 вокселей).
Листовые воксели (leaf voxels) – Количество активных вокселей, хранящихся в листовых узлах. В отличие от вокселей, этот подсчёт не включает воксели, принадлежащие тайлам более высокого уровня.
Тайлы (tiles) – Количество активных тайлов в сетке. Тайлы – это контейнеры вокселей более высокого уровня, используемые форматами разреженных томов (например, OpenVDB) для оптимизации хранения.
Размер (size) – Примерный объём памяти сетки, включая все выделенные в данный момент воксельные и тайловые данные.
Эти статистические данные позволяют анализировать сложность, плотность и затраты на производительность для объёмных данных, создаваемых геометрическими нодами или импортированными файлами объёмов.
Примечание
Поскольку в сетках объёма используется разреженная структура данных, их значение „протяжённости“ может быть значительно больше фактического числа активных вокселей. В памяти хранятся только активные области сетки, что обеспечивает эффективность работы с объёмными данными даже для больших областей.
Панель состояния (status bar)
Строка состояния показывает количество строк и столбцов, а также количество строк, оставшихся после фильтрации.