Боковая панель
Инструмент (tool)
Отображает настройки активного инструмента.
Изображение (image)
Изображение (image)
Инструменты для работы с изображениями. См. «настройки изображения».
Метаданные (metadata)
Список метаданных изображения.
Вид (view)
Отображение (display)
На этой панели вы можете настроить параметры отображения редактора.
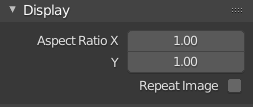
Панель «отображения».
- Соотношение сторон (aspect ratio)
Отображение сторон этого изображения. Не влияет на рендеринг.
- Повторять изображение (repeat image)
Разместить изображение так, чтобы оно полностью заполнило редактор.
Аннотации (annotations)
Параметры для инструмента заметок. См. «аннотации».
Диапазоны (scopes)
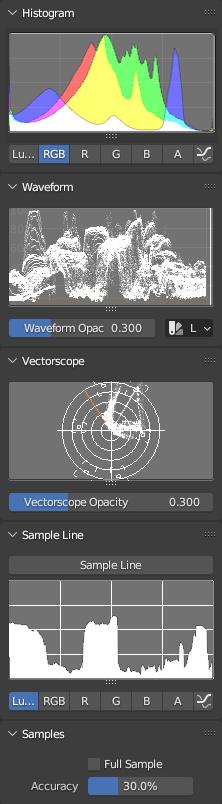
Диапазоны в редакторе изображений.
Отображает различные виды статистической информации о цветах изображения.
Обратите внимание, что вкладка диапазоны не отображается, если активный объект находится в режиме редактирования или текстурирования.
Гистограмма (histogram)
Отображает график распределения цвета на изображении. Для каждого значения цвета (например, яркости) по оси X отображается количество пикселей с этим значением по оси Y. Преимущественно тёмное изображение будет иметь самые высокие значения в левой части графика.
Используйте этот режим, чтобы сбалансировать тональный диапазон изображения. Хорошо сбалансированное изображение должно иметь приятное плавное распределение цветовых значений.
Вы можете перетащить ЛКМ по гистограмме, чтобы отрегулировать её вертикальный масштаб.
- Яркость (luma)
Показывает гистограмму яркости.
- RGB
Показывает каналы RGB, расположенные друг над другом.
- R/G/B/A
Показывает один цветовой канал.
- Показать линию (show line)
Отображает линии, а не заполненные фигуры.
Волновая форма (waveform)
Строит распределение цвета для каждой вертикальной линии пикселей изображения. Ось X волновой формы соответствует оси X изображения, а ось Y представляет диапазон цветового компонента, такого как яркость. Чем ярче конкретная точка, тем больше пикселей в этой вертикальной линии имеет это значение цвета.
- Непрозрачность волновой формы (waveform opacity)
Непрозрачность точек.
- Режим волновой формы (waveform mode)
- Яркость (luma)
Показать одну форму волны, отображающую распределение яркости.
- YCbCr
Показать формы сигналов Y, Cb и Cr рядом.
- Парад (parad)
Показать сигналы R, G и B рядом.
- Красный-зелёный-синий (red green blue)
Показать формы сигналов R, G и B, наложенные друг на друга.
Вектороскоп (vectorscope)
Показывает радиальное распределение цвета. Угол представляет оттенок, а расстояние от центра – насыщенность.
- Непрозрачность вектороскопа (vectorscope opacity)
Непрозрачность точек.
Значения вдоль отрезка (sample line)
Область значений вдоль отрезков такая же, как и гистограмма, но позволяет вам получить выборочные данные из линии.
- Значения вдоль отрезка (sample line)
Используется для проведения линии, из которой считываются данные выборки.
Сэмплы (samples)
- Все сэмплы (full sample)
Сэмплирует каждый пиксель.
- Точность (accuracy)
Доля пикселей изображения для сэмплинга, если опция «все сэмплы» – отключена.