Presentación en vistas
- Grosor
Factor that scales the thickness of the grid that is currently being displayed.
- Interpolación
Método de interpolación a utilizar para la visualización de la cuadrícula de fluido.
- Lineal
Interpolación lineal entre vóxeles. Da buena suavidad y velocidad.
- Cúbico
Interpolación cúbica entre vóxeles. Da una interpolación suavizada de alta calidad, pero es más lenta.
- Más cercano
Sin interpolación entre vóxeles. Da vóxeles en bruto.
- Rebanadas por vóxel
Determines how many slices per voxel should be generated.
Rebanar
Representa sólo una única sección 2D del objeto de dominio.
- Eje
- Automático
Ajusta la dirección del corte según la dirección de la vista.
- X/Y/Z
Slice along the X/Y/Z axis.
- Posición
Posición del corte en relación con la longitud del lado del dominio respectivo.
- Gridlines Closest Interpolation Only
Display gridlines to differentiate the underlying cells in the current slice of the fluid domain.
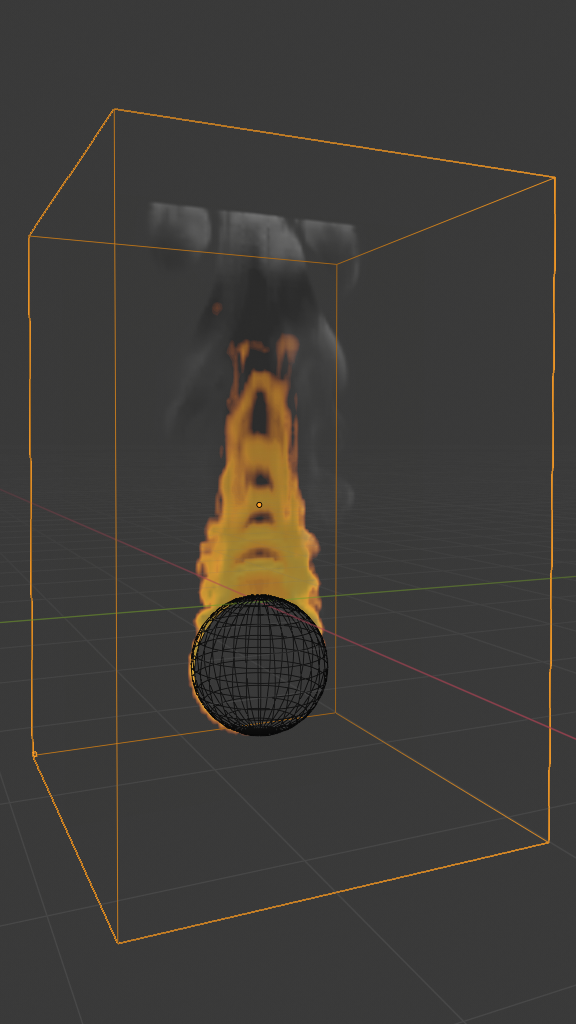
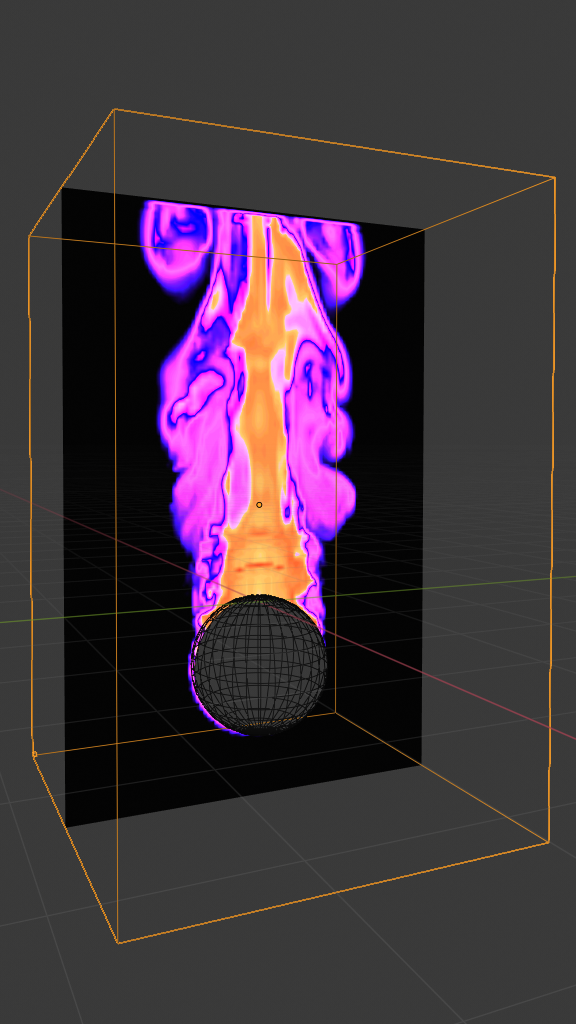
Visualización de cuadrícula
Use a specific color map for the visualization of the simulation field. This comes in handy during debugging or when making more advanced adjustments to the simulation. For instance, if the actual color of a fire simulation is barely visible in the viewport then changing the color profile can help to see the real size of the flame.
- Field
The simulation field used in the display options (e.g. density, fuel, heat).
- Escala
Scale the selected simulation field by this value.
Visualización de vectores
Opciones de visualización para los campos vectoriales.
- Mostrar como
- Líneas de flujo
Permitirá mostrar los vectores en forma de «Líneas de flujo».
- Agujas
Permitirá mostrar los vectores en forma de «Agujas».
- Cuadrícula MAC
Permitirá mostrar los vectores en forma de cuadrícula «Marker-And-Cell» (marcador y celda).
- X/Y/Z
Permitirá mostrar cada componente individual X/Y/Z de la cuadrícula MAC.
- Magnitud sólo Líneas de flujo o Agujas
Escalará los vectores mostrados según la magnitud de los vectores por ellos representados.
- Field
El campo vectorial, representado por los vectores mostrados (p.ej: velocidad del fluido, fuerzas externas).
- Escala
Escalará los vectores en las vistas usando este valor.
Avanzado sólo Líneas de cuadrícula
Opciones avanzadas de coloreado para las líneas de la cuadrícula.
- Colorear líneas de cuadrícula
- Indicadores
Coloreará las líneas de la cuadrícula usando indicadores.
- Rango a resaltar sólo Visualización de cuadrícula
Resaltará las celdas que contengan valores dentro del rango especificado, en la cuadrícula mostrada. Los valores que se encuentren entre el Límite inferior y Límite superior establecidos (inclusive) serán considerados como dentro del rango.
- Límite inferior
Límite inferior del rango a ser resaltado.
- Límite superior
Límite superior del rango a ser resaltado.
- Color
Color a ser usado para resaltar las celdas.
- Tipo de celda
Permitirá resaltar sólo un tipo particular de celdas.