Nodo Visor
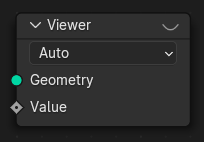
The Viewer node allows viewing data from inside a geometry node group in both the Spreadsheet Editor and the 3D Viewport.
Any geometry or attribute connected to the viewer can be visualized in the viewport, and its evaluated attribute values can be inspected in the spreadsheet. Other data can also be viewed and inspected such as scalar values and grids by showing them in the spreadsheet.
Nota
The Viewer node cannot be used in the Tool context—only in the Modifier context.
Uso
Activación y desactivación
Use Shift-Ctrl-LMB on any node or socket to connect it to the active viewer.
In the viewport View menu, the Viewer Node option can toggle the visibility of all viewer visualizations, allowing you to compare the evaluated result with the final object output.
Atajos de teclado
The Viewer node system provides shortcuts to quickly assign and activate viewers:
Assign Shortcut (Ctrl-1, Ctrl-2, etc.): Select a viewer node and press a shortcut to assign it to that number. The assigned number appears in the upper-right corner of the node.
Activate Viewer (1, 2, etc.): Press the assigned number key to activate the corresponding viewer node.
Nota
Only number keys (1 - 9) are supported.
Visionado de valores de conectores individuales
In addition to using the Viewer node, single-value sockets can display their evaluated values directly within the node editor. When enabled, the current evaluated value is shown beside the socket input, making it easy to inspect and debug data flow without connecting a Viewer node.
This feature is available for scalar and small data types, such as Float, Integer, Boolean, or Vector sockets.
When viewing data-block values, the Viewer node displays the data-block’s name along with its icon, making it easy to identify the referenced data-block.
For Collections, the assigned color tag is also displayed.
The displayed values update interactively as the node tree evaluates or parameters change.
Nota
Complex data types such as geometry or grids cannot be previewed this way and must be visualized using the Viewer node or the Spreadsheet Editor.
Visionado campos de atributos
When the Viewer node has both a Geometry and a field input connected, the values can be visualized directly in the 3D Viewport via the Viewer Overlay.
The attribute’s domain is determined automatically when possible. Otherwise, the Viewer defaults to the Face Corner domain for meshes and the Point domain for curves. The domain can also be set manually from the node’s properties.
In the Spreadsheet Editor, only the columns for attributes corresponding to the currently selected domain are shown.
Importante
The Geometry socket must be first.
Fijar
The Viewer node can be pinned in the Spreadsheet Editor to keep its data visible even when it becomes inactive. When pinned, the Spreadsheet continues showing the data from the pinned Viewer node, regardless of changes to the active object or node selection.
Entradas
Inputs can be added by dragging a socket into the blank socket or from the Elementos del Visor properties.
Propiedades
- Dominio
The attribute domain used to evaluate the Value input. The Auto option chooses the domain automatically based on the connected nodes.
Elementos del Visor
- Tipo de conector
El tipo de datos usados para evaluar la entrada.
- Eliminar automáticamente
Remove the item automatically when it is unlinked.
Salidas
Este nodo no tiene salidas.
Ejemplos
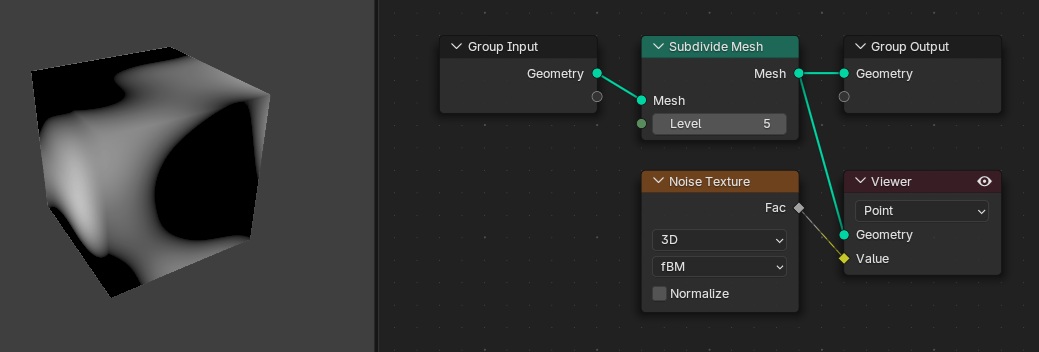
Visualizing the Noise Texture Factor on the default cube.
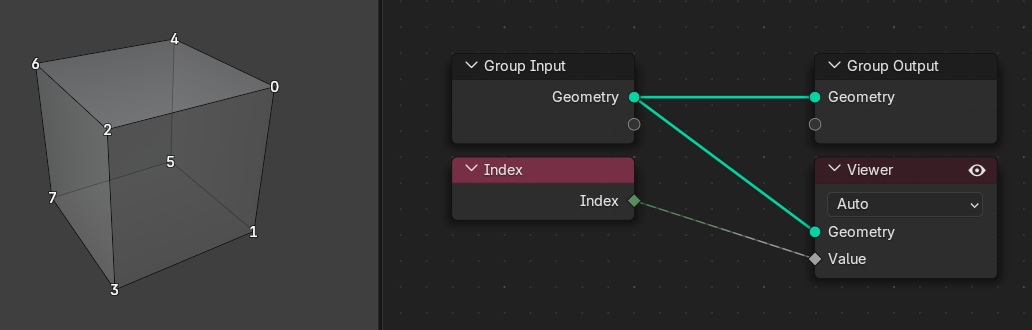
Visualizing the Index Attribute as text on the default cube.