Modo de visualización
Using this pop-up, you can choose between displaying the preview image or a scope that visualizes its color distribution.
Previsualización de imagen
Previews what the final video will look like, and lets you change the image layout using various tools.
Forma de onda de luma
This scope visualizes the luminosity (brightness) distribution of the image, letting you see at a glance if there’s enough contrast and if any areas are under- or overexposed.
The scope works by plotting a curve for each scanline in the current video frame. Another way of saying this is that each pixel column in the luma waveform is a brightness histogram of the corresponding pixel column in the frame. Specifically:
The horizontal position of a pixel in the waveform refers to a pixel column in the frame.
The vertical position of a pixel in the waveform refers to a brightness value, going from 0 at the bottom to 1 at the top.
The brightness of a pixel in the waveform indicates how many pixels in the above frame column have the above brightness. If no pixels in the frame column have this brightness, the waveform pixel is black. If at least three pixels in the frame column have this brightness, the waveform pixel is white.
Los ejemplos a continuación muestran dos imágenes y sus correspondientes formas de onda de Luma.
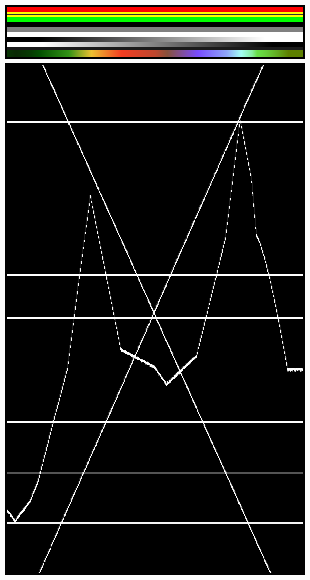
Las varias líneas horizontales en la forma de onda Luma coinciden con las líneas de color uniforme de la imagen. Nótese que la línea en “gris 20%” de un píxel de ancho (dentro de la franja amarilla), está representada en la forma de onda Luma por una línea gris. Las dos líneas que dibujan una «X» corresponden a los dos gradientes monocromáticos. Finalmente, la línea discontinua coincide con el gradiente de color en la parte inferior.¶ |
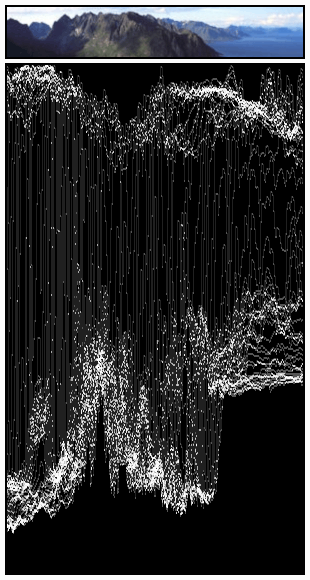
Las curvas son bastante visibles. Se puede apreciar una luminancia del 80-100% para el cielo, una de alrededor del 40% para el mar y una del 10-20% para las montañas, creciendo hasta alrededor del 40% para la parte soleada.¶ |
Presentación RVA
Shows three waveforms – for the red, green, and blue color channels – instead of just one for the overall image brightness.
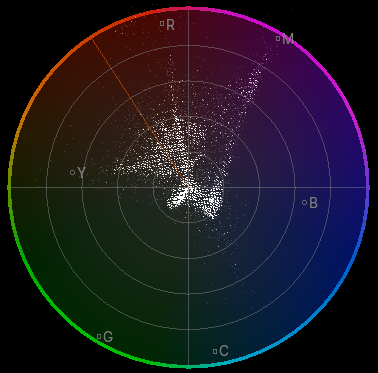
Vectorscopio de croma
This scope visualizes the color distribution of the image. Each point has:
An angle indicating its hue.
A distance-from-center indicating its saturation.
A brightness indicating how many pixels in the video frame have the above hue and saturation.
Histograma
Shows three overlapping graphs, one for each color channel. Within each graph:
The X axis corresponds to color intensity, going from 0 on the left (black) to 1 on the right (fully red/green/blue).
The Y axis corresponds to number of pixels.
Use este modo para equilibrar el rango tonal en una imagen. Una imagen bien equilibrada debería tener una distribución buena y suave de valores de color.
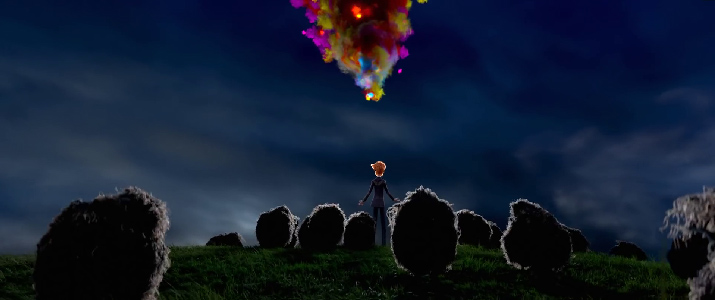
Imagen de ejemplo.
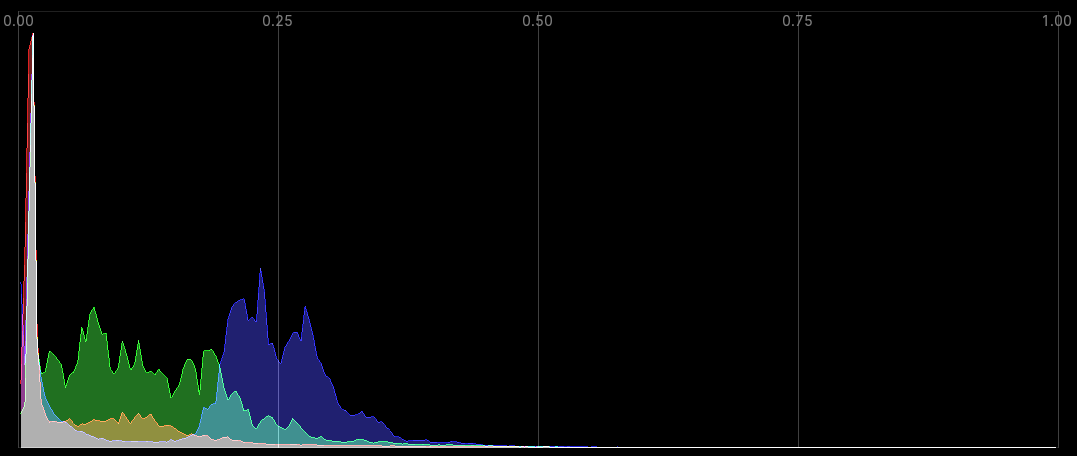
El histograma correspondiente.