Нода «Текстура Габора» (Gabor texture node)
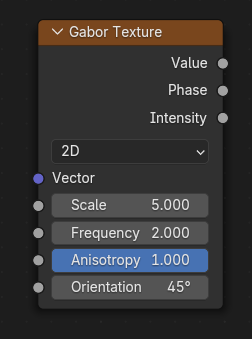
Нода Gabor Texture оценивает шум Габора по входным координатам текстуры. Шум Габора визуально характеризуется случайными чередующимися полосами, направление и ширину которых можно контролировать. Кроме того, его можно использовать для создания всенаправленного шума, как и стандартную ноду Noise Texture, но поскольку его вычисление более затратно – использование ноды Noise Texture, вероятно, является лучшим вариантом в этих случаях. Смотрите примеры для получения дополнительной информации.
Входы (inputs)
- Вектор (vector)
Координаты, в которых будет оцениваться шум Габора. Z-Компонента в 2D-случае – игнорируется. Если сокет остаётся неподключённым – координаты текстуры по умолчанию стоят на Generated.
- Масштаб (scale)
Масштаб шума Габора.
- Частота (frequency)
Частота, с которой шум Габора изменяется в пространстве. Есть отличие от ввода Scale тем, что масштабируется только перпендикулярно направлению шума Габора.
- Анизотропия (anisotropy)
Направленность шума Габора. 1 означает, что шум полностью направленный, а 0 означает, что шум всенаправленный.
- Ориентация (orientation)
Направление анизотропного шума Габора. Это угол для 2D-случая, тогда как для 3D-случая это единичный вектор направления.
Свойства (properties)
- Тип (type)
Тип текстуры шума Габора.
- 2D:
Вычисляет шум в двухмерном пространстве. Z-Компонента входного вектора игнорируется.
- 3D:
Вычисляет шум в трёхмерном пространстве.
Примечание
Чем больше измерений, тем больше времени рендеринга, поэтому следует использовать меньше измерений, если только они не требуются для вашей задумки.
Выходы (outputs)
- Значение (value)
Значение шума Габора со случайной интенсивностью и фазой. Это равно синусу фазы, умноженному на интенсивность.
- Фаза (phase)
Фаза шума Габора, не имеющая случайной интенсивности.
- Интенсивность (intensity)
Интенсивность шума Габора, не имеющего случайной фазы.
Примеры
В следующей таблице показаны различные выходные данные ноды с различными параметрами. Как можно видеть, шум визуально характеризуется чередующимися полосами, которые, как правило, ориентированы в определённом направлении. Но параметр Anisotropy может быть уменьшен ниже 1, чтобы сделать направления полос более случайными. Параметр Frequency определяет количество полос, перпендикулярных направлению шума. Однако параметр Scale также можно использовать для глобального увеличения количества полос, поэтому сначала рассмотрите возможность увеличения масштаба, поскольку высокочастотный шум может страдать от низкого контраста и ограниченного чередования полос.
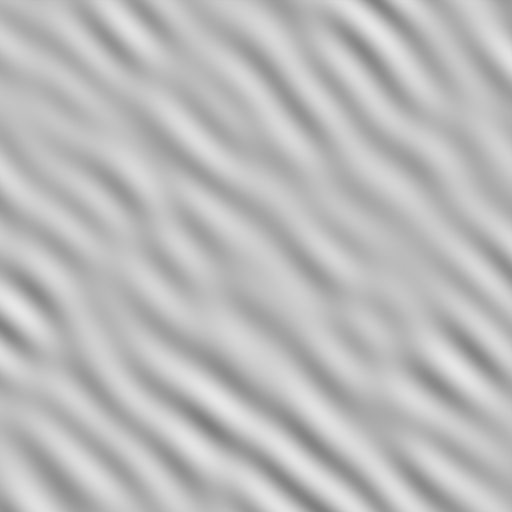
Вывод Value. Frequency = 2. Anisotropy = 1.¶ |
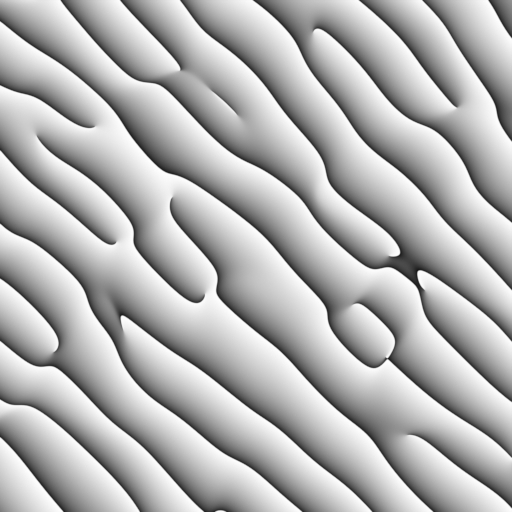
Вывод Phase. Frequency = 2. Anisotropy = 1.¶ |
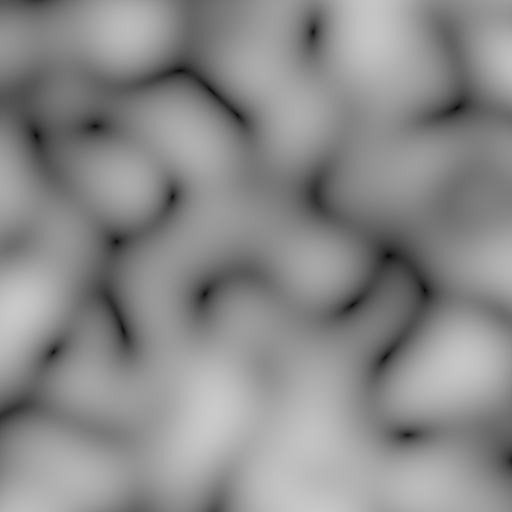
Вывод Intensity. Frequency = 2. Anisotropy = 1.¶ |
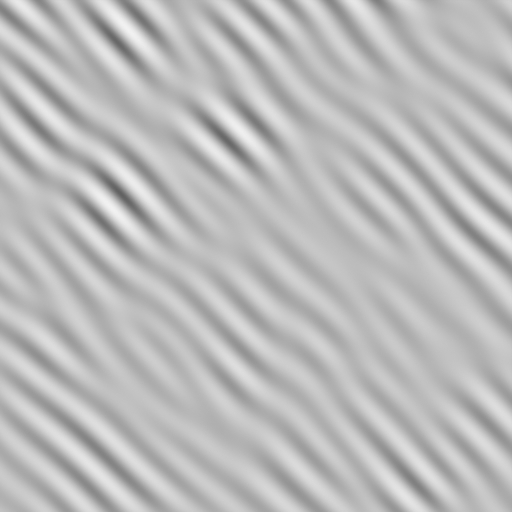
Вывод Value. Frequency = 3. Anisotropy = 1.¶ |
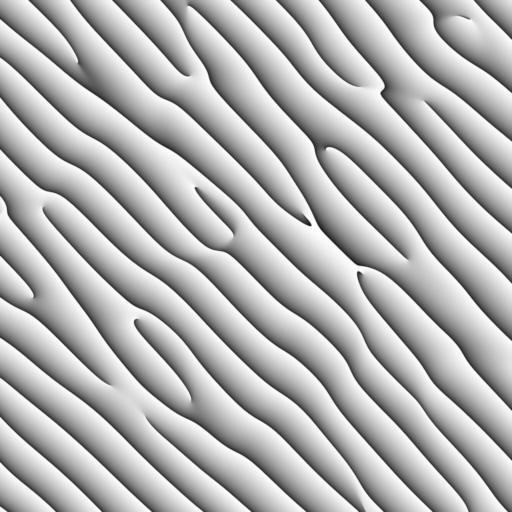
Вывод Phase. Frequency = 3. Anisotropy = 1.¶ |
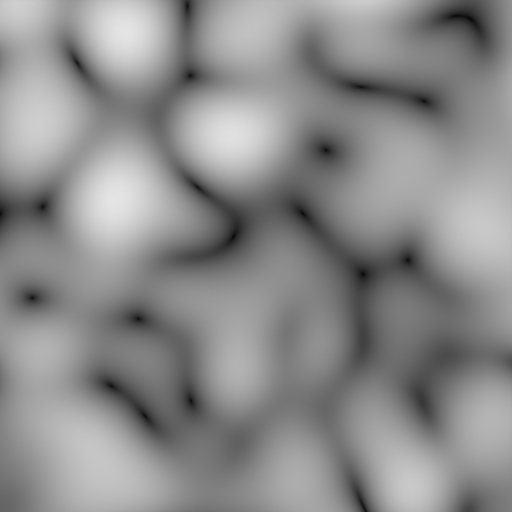
Вывод Intensity. Frequency = 3. Anisotropy = 1.¶ |
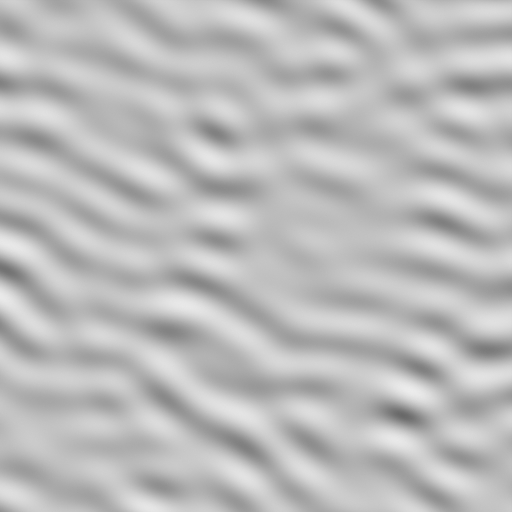
Вывод Value. Frequency = 2. Anisotropy = 0.7.¶ |
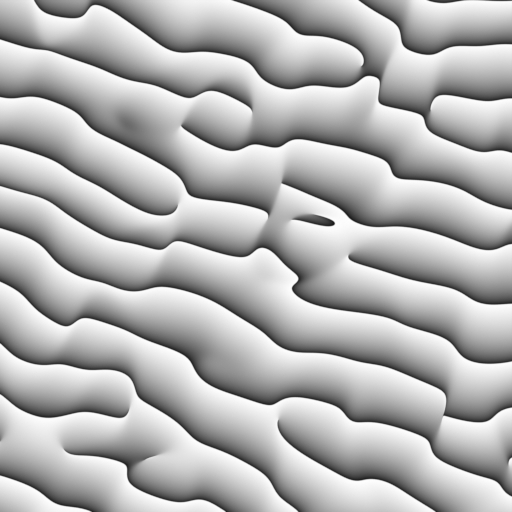
Вывод Phase. Frequency = 2. Anisotropy = 0.7.¶ |
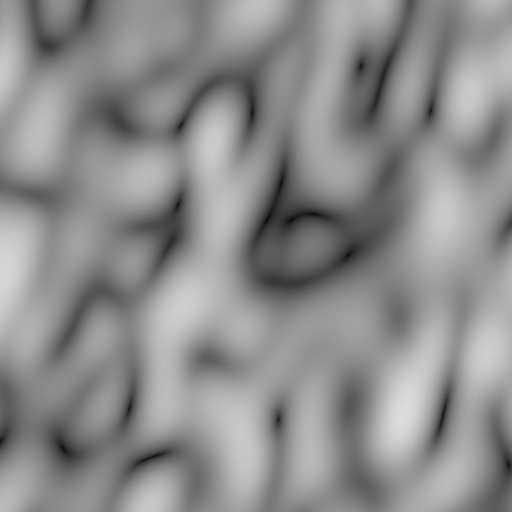
Вывод Intensity. Frequency = 2. Anisotropy = 0.7.¶ |
Шум Габора разбивается на компоненты Phase и Intensity, где значение Габора вычисляется как синус фазы, умноженной на интенсивность, при этом вывод фазы нормализуется до диапазона [0, 1].
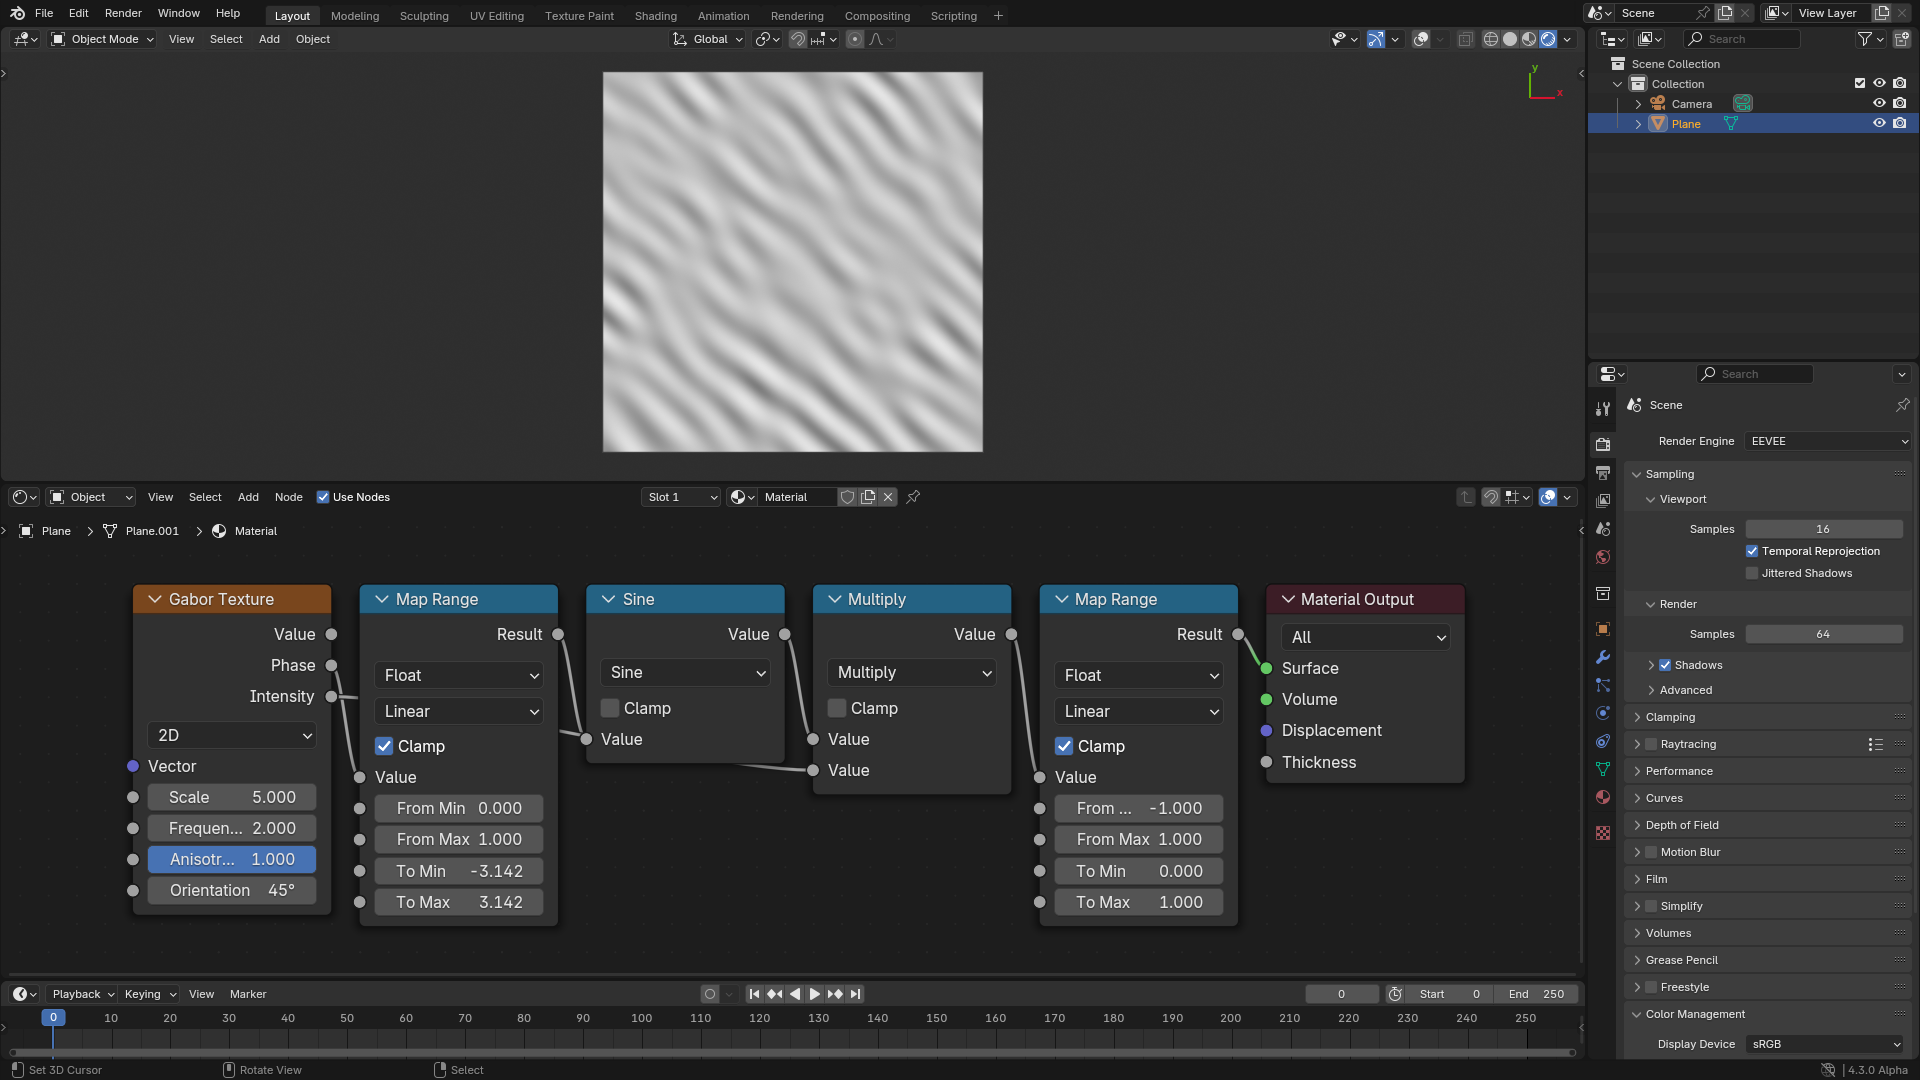
Вычисление выходного значения из выводов Phase и Intensity.
Преимущество выхода Phase заключается в том, что он не имеет случайных интенсивностей и областей с низкой контрастностью, как на выходе Value, поэтому его можно использовать в качестве основы для текстур, которые по своей природе более структурированы, например для текстуры песчаных дюн.
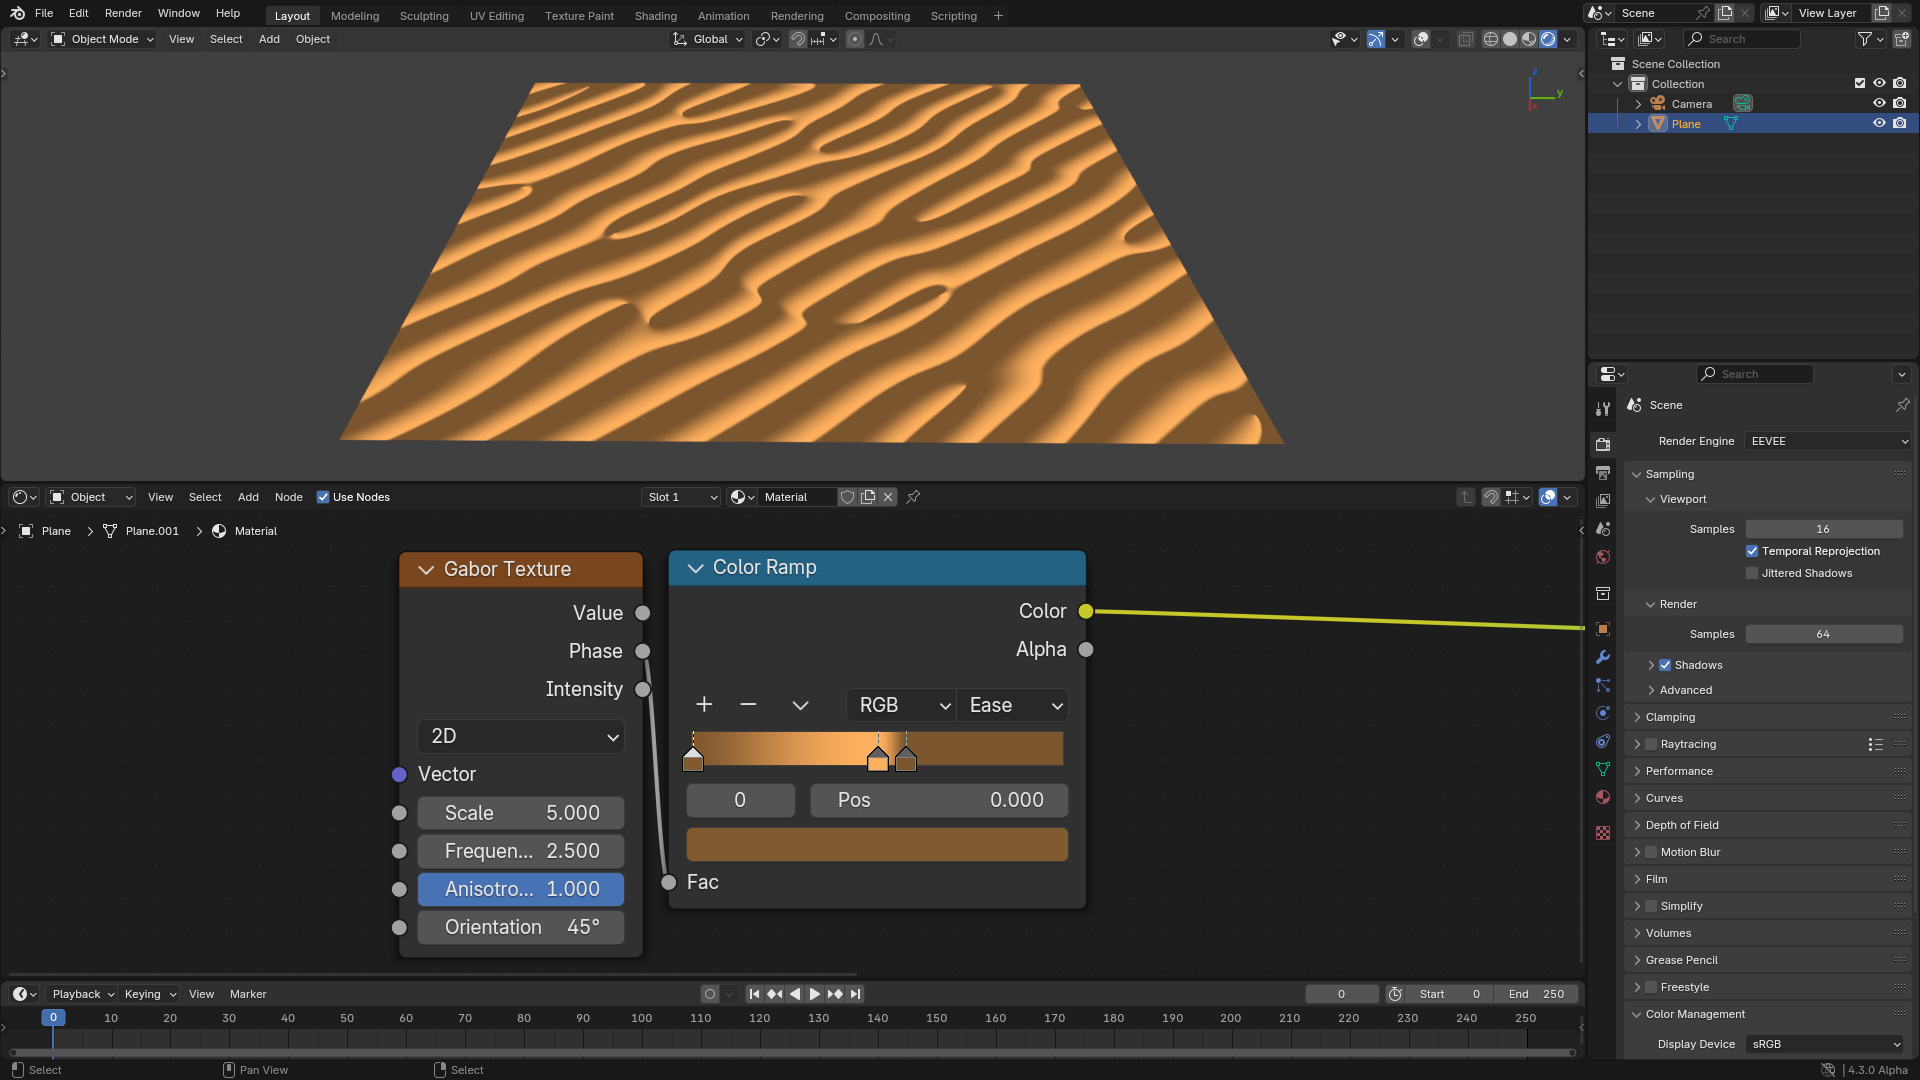
Структуры, похожие на песчаные дюны, создаются с использованием фазового выхода.
Главное преимущество и применение вывода Intensity заключается в том, что он предоставляет информацию о местоположении сингулярностей на выводе Phase. Сингулярности – это те области в фазе, где встречаются полосы, которые показаны красным на следующем рисунке. Эти области будут близки к нулю на выводе Intensity. Поэтому, если эти области нежелательны – их можно скрыть, умножив на вариант вывода Intensity.
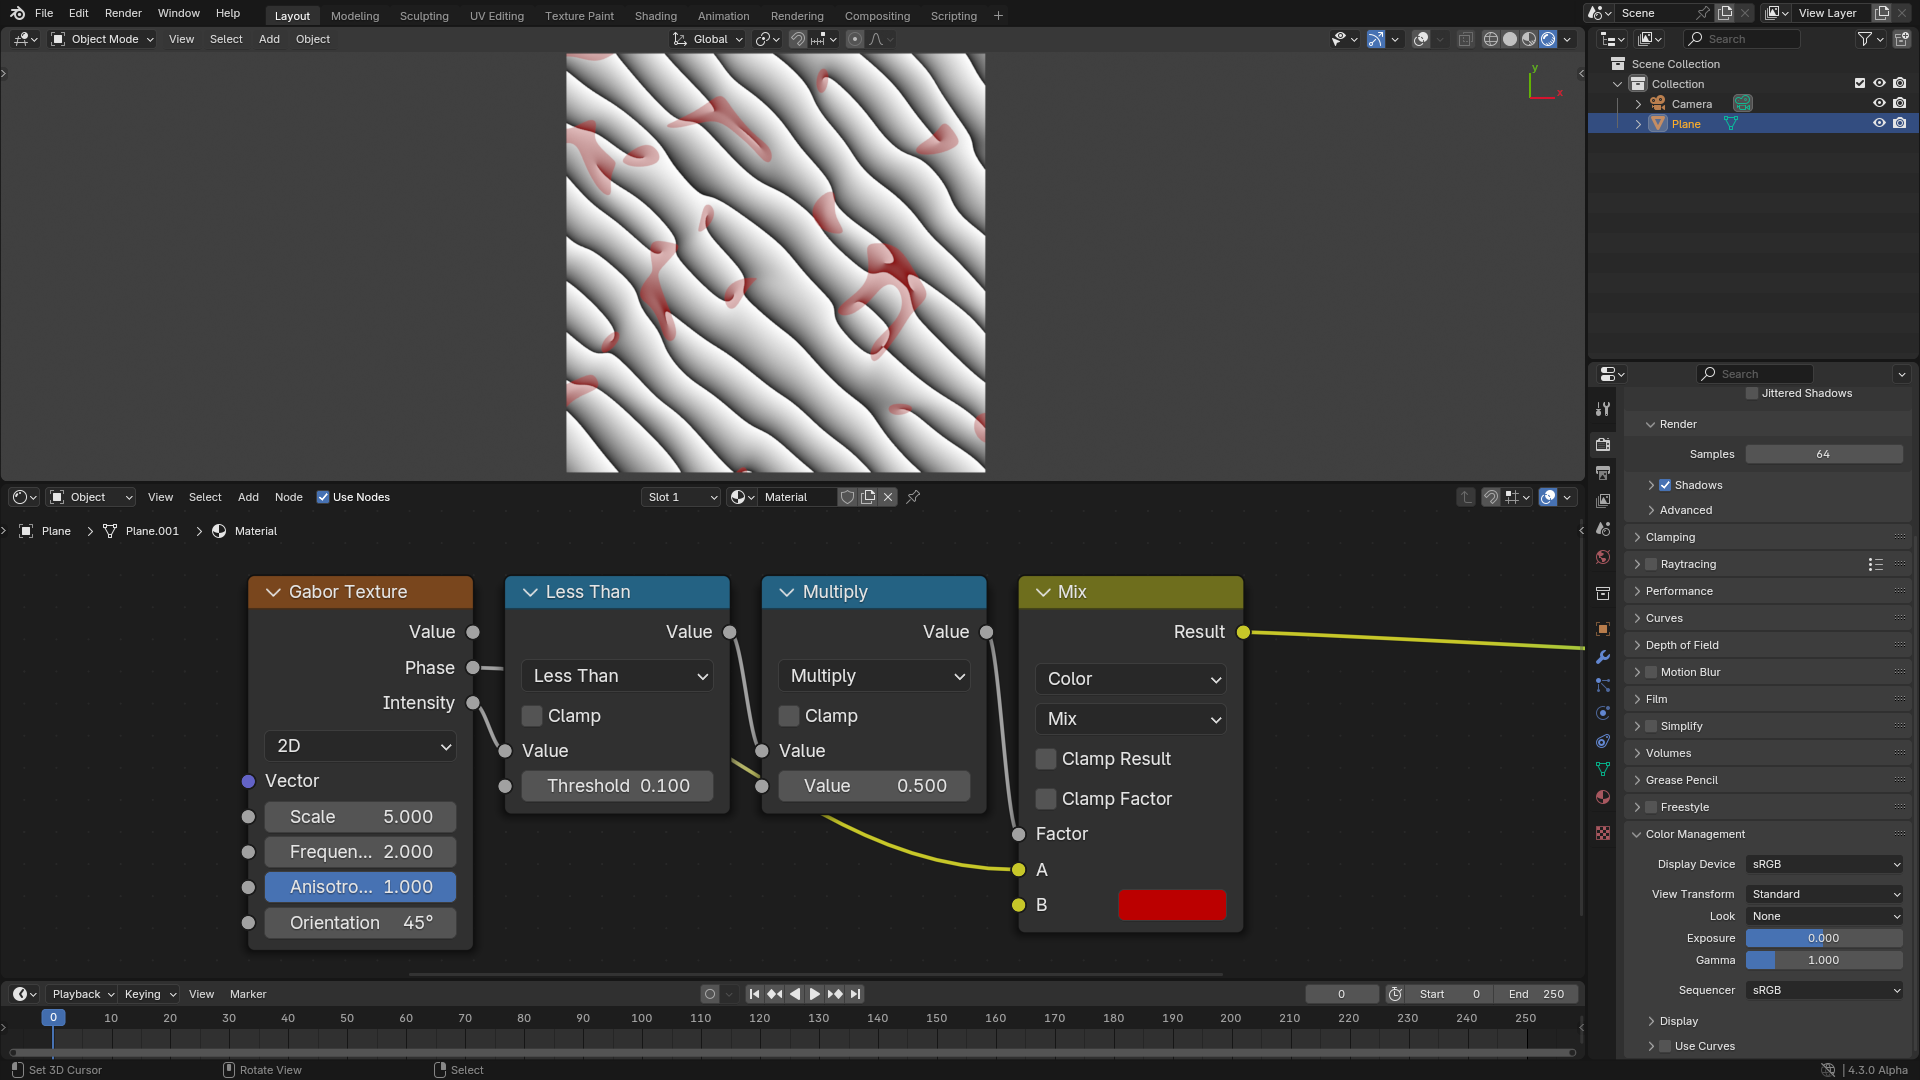
Визуализация областей, где возникают сингулярности.
Входы можно варьировать в зависимости от пространства, чтобы получить более интересные шаблоны.
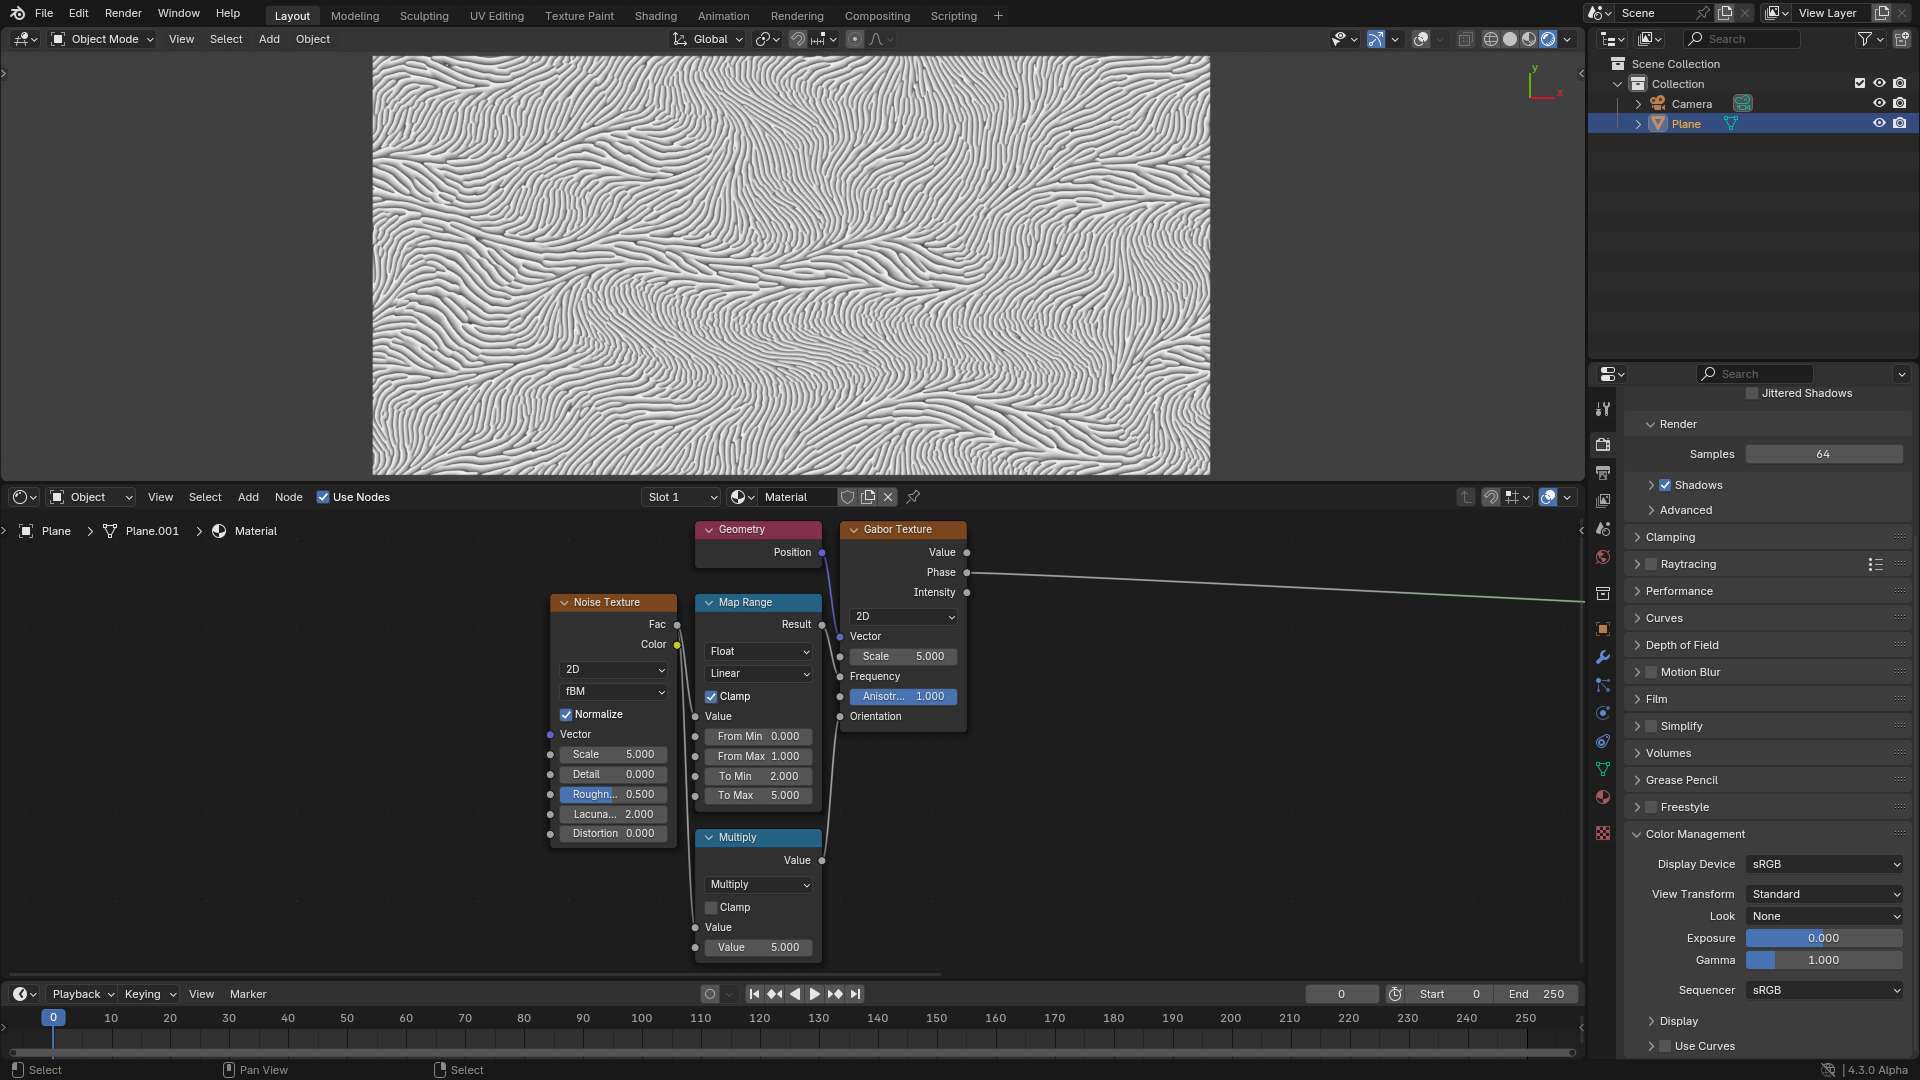
Изменение частоты и ориентации в пространстве.